Capitalism is so ingrained in human nature, that even in the Soviet Union, not having studied or heard about it and its demand and supply laws, soviets knew how much could be charged for goods or services in the black market… (1)
I remembered those words very well when we travelled last year to New York to run its marathon.
On Friday 31st, October, we arrived to New York by car, coming from a tour that had taken us to Dayton. Before going to the hotels and leaving the rental car, we wanted to go by the Marathon Expo to retrieve the running bibs. It was located at the Javits Center, by the 11th Avenue between the 34th and 39th streets, in Manhattan.
In the picture you can see a sign post saying Park (at the 34th). That is where we left the car while we went to the Marathon Expo.
Waiting to be attended at the car park, we were reading a panel with prices: 16$ the 1st hour, the following hours being cheaper. The driver in the car in front of us started a discussion with an employee of the car park which went more or less like this:
(employee) The first hour is 30$, two hours, 50$…
(customer) Excuse me? In the panel it says it’s 16$ the first hour!
Sir, the panel says those are the prices excluding event days, today is an event day.
How do you go from 16 to 30$!
Sir, 16$ plus x dollars for being event day, plus x for taxes… sir, you are driving a Porsche Cayenne, if you think 30$ is too expensive feel free to back up and park somewhere else…
Speechless, I produced 50$ in notes :-). (2)
—
(1) He referred to Capitalism as the economic system in which trade seeks for profit and how demand and supply laws work, don’t look any further in the comment.
(2) The driver of the Porsche Cayenne did so, too.
Thomas Friedman is an American journalist who writes for The New York Times. He is specialized in foreign affairs, especially the Middle East, for which he has received 3 times the Pulitzer Prize on international reporting and commentary. Friedman wrote “Hot, Flat and Crowded” in 2008. In it he tackled the environmental issue.
In 2005 he wrote “The World is Flat”, where he argued that technological revolution had leveled the playing field and made the world more connected, more competitive and collaborative.
In this book, he claims that as we are entering the “Energy-Climate Era” the world is getting hot (global warming), flat and crowded (soaring population growth), and clear action needs to be taken to address these issues. Government need to establish a clear regulatory framework, clear price signals to establish a market in which companies can innovate to solve the problems at hand.
The author included in the book dozens of references, quotes from conversations, excerpts of speeches from leading figures, and several examples. While reading it, I felt as if the author repeated himself often and that those ideas could have been conveyed in a shorter and more direct book (~480 pages in the version I have). Nevertheless, now, a few months later, going back through different marks and notes I made throughout the book I realize the great work and reference book that he put together. I would therefore recommend the reading of the book.
I wanted to share below some of the notes I made along the book, grouped by theme.
On climate change, its science, sceptics, denials…
Harvard’s John Holdren says “A charlatan can tell a lie in one sentence that a scientist needs three paragraphs to rebut”.
A good source: Pew Research Center on Climate Change report “Climate Change 101” series.
Even if forecasts are not 100% sure about future scenarios, as Andrew C. Revkin, the New York Times environment reporter, says:
“Uncertainty is the reason to act”. When you perceive some risky situation in your life or business you try to insure yourself against it, you don’t adopt the position of sitting around and say “Gosh, no one can predict with any certainty when lightning is going to hit that forest…”
On the dependency of oil, what it provokes and why it is needed to reduce it.
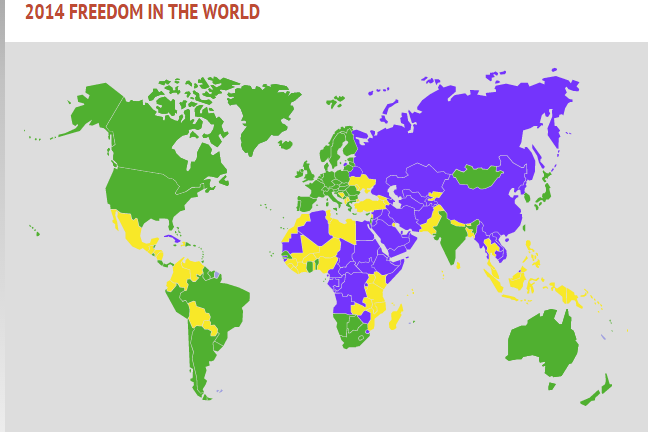
The reliance of the West in oil is helping finance a reversal of the democratic trends around the globe. What the author calls “the First Law of Petropolitics: As the price of oil goes up, the pace of freedom goes down and as the price of oil goes down, the pace of freedom goes up”.
[…]
“We are financing the US Army, Navy, Air Force and Marine Corps with our tax dollars, and we are indirectly financing with our energy purchases, al-Qaeda, Hamas, Hezbollah, and Islamic Jihad”.
“Dutch disease” refers to the process of de-industrialization that can come as a result of a natural resource windfall. The term originated in the Netherlands after the discovery of natural gas deposits in the 1960s. The influx of cash from oil make raises the nation’s goods prices making them uncompetitive to export markets and at the same time citizens buy low-cost imported manufactured goods, provoking the wiping out of the manufacturing sector.
A paper studying the same topic: “Does oil hinder democracy?” (PDF, World Politics, April 2001) by political scientist Michael L. Ross from UCLA. Using a statistical analysis of 113 states between 1971 and 1997 he found evidence of what he described as “resource trap”.
An old anecdote:
Saudi Arabian oil minister Yamani said to OPEC members in the 1970 “Remember, the Stone Age didn’t end because we ran out of stones.” It ended because people invented alternative tools made of bronze and then iron.
[I leave to you the making the connection with supply and pricing decisions from OPEC]
A reflection from former Secretary of State Condoleezza Rice stated before the Senate Foreign Relations Committee (April 5, 2006; transcript):
“I can tell you that nothing has really taken me aback more as secretary of state than the way the politics of energy is –I will use the word warping- diplomacy around the world. It has given extraordinary power to some states that are using that power in not very good ways for the international system, states that would otherwise have very little power.”
On the need to take action, to foster energy technology solutions, to create strong regulations, to create a market, etc.
“Mother Nature is just chemistry, biology and physics. Everything she does is just the sum of those three things. She’s completely amoral. She doesn’t care about poetry or art or whether you go to church. You can’t negotiate with her, and you can’t spin her and you can’t evade her rules. All you can do is fit in as a species. And when a species doesn’t learn to fit in with Mother Nature, it gets kicked out […] every day you look in the mirror now, you’re seeing an endangered species.”
Jeffrey Immelt, CEO of General Electric, in a speech entitled “An American Renewal” (June 26, 2009), lamented the direction taken decades ago by businesses and politics:
“[…] Many bought into the idea that America could go from a technology-based, export-oriented powerhouse to a services-led, consumption-based economy – and somehow still expect to prosper”.
A positive note from John Gardner, founder of Common Cause:
“a series of opportunities disguised as insoluble problems”.
Different excerpts from Friedman’s book:
Mother Nature, the global community, your own community, your own customers, your own neighbors, your own kids, and your own employees are going to demand that you, your company, or your country pay “the total cost of ownership” for whatever you produce or consume, including “the costs that are near-term and long-term, direct and indirect, seen and hidden, financial, social, geopolitical, and environmental”.
[…]
“A green revolution? Have you ever seen a revolution where no one got hurt? That’s the revolution we are having. In the green revolution we are having everyone is a winner, nobody has to give up anything, and the adjective that most often modifies “green revolution” is “easy”. That’s not a revolution. That’s a party. We’re actually having a green party. And, I have to say, it’s a lot of fun. […] It’s all about looking green. There are no losers. The American farmers are winners. They’re green. They get to grow ethanol and garner huge government subsidies for doing so, even though it makes no real sense as a CO2-reduction strategy. Exxon Mobile says it’s getting green and General Motors does too. […] I’m sure Dick Cheney is green […].”
[…]
Utilities business involves enormous sunk costs that must be recovered regardless of how much energy they sell. Utilities have vital interest in boosting electricity and gas sales to recover its fixed costs.
[…]
“Price the road and clear the traffic”. If you want fewer CO2 emitters, charge people for emitting.
The International Energy Agency produced in 2000 a report “Experience Curves for Energy Technology Policy” that underscored the need of price signals from the government to quickly move down along the learning curve.
The lingering uncertainty about the long-term price of oil is also why some of the biggest energy companies hesitate to make big bets on green innovation.
[…] A strong regulation eliminates regulatory uncertainty and provides a powerful competitive incentive […] to innovate.
[…]
America needs an energy technology bubble just like the information technology bubble. It then quotes Bill Gates words at Davos in 1999 when asked whether there was an internet bubble: “Of course they’re a bubble. But you’re all missing the point. This bubble is going to attract so much new capital to this Internet industry that it is going to drive innovation faster and faster.”
[…]
We have been fooling ourselves with fraudulent accounting by note pricing those externalities with surcharges that reflect the true risks and costs that they entail.
Introduction of the concept “green hawk”. The author realized that outgreening could be a military strategy after learning of the “green hawks” movement in the US military in 2006. It all started with Major General Zilmer’s complains to the Pentagon that he needed alternatives for the diesel fuel powering electricity generators in Iraq. A study found that 90% of the diesel used at a forward operating base were employed in generation of electricity while only 10% in mobility, and 95% of that electricity was consumed to air-condition tents. A holistic view of the situation was needed. By employing different materials that provided better isolation to the heat, the Army could save fuel and thus costs and lives of soldiers trucking fuel up and down the Iraqi roads. Thus, as the articled I linked states: “oil is a tactical liability”.
Miscellanea.
An interesting note by Andrew Revkin in an article at The New York Times (September 15, 2009) “Contraception is greenest Technology”. This is linked to the “Crowded” in the title which I have barely addressed along the review, but it is worth noting that overpopulation coupled with energy usage and economic growth is a big threat to climate change.
“The country needs to put in place what he calls the winning formula: REEFIGDCPEERPFPCA < TCOBOCG; a renewable energy ecosystem for innovating, generating, and deploying clean power, energy efficiency, resource productivity, family planning, conservation, and adaptation < the true cost of burning coal, oil, and gas.”
And a reference to this classic, the speech by 12-year-old Severn Suzuki at the 1992 Earth Summit in Rio de Janeiro.
“If you don’t know how to fix it, please stop breaking it!”
—
Personal note: Luca and I visited Peru in 2009. In that trip we spent some days in the Amazon. Friedman and his family apparently had been in the same place in June 2006: in Peru’s Rio Tambopata, to visit a research station. I liked the description of one of the things we loved of that experience:
Listen to the rain forest symphony outside. “It sounded like one of those dissonant pieces of modern music: a cacophony of birds, red howler monkeys, wild pigs, frogs, and insects making bizarre clicks, snorts, croaks, chirps, wails, and whistles…”
A few days ago I published a book review of “The Roaring Nineties” by the Nobel prize Joseph E. Stiglitz. I wanted to share here some passages related to how shareholders, investors are mistreated by those who are supposed to work for them and how alignment of incentives play a role in this.
[On boards of directors] “Here again there was another conflict of interest. Boards are supposed to protect the interests of all shareholders. But some boards, whose members often receive large fees for membership and attendance, were frequently more concerned with pleasing the CEO than fulfilling their supposed fiduciary responsibilities.”
[On one-offs] “[executives] found ways to boost their earnings – through sam transactions which allowed them to book revenues even if they didn’t really have them, or by moving expenses off the books, or by using one-time write-offs (time and time again), to try to give the appearance of robust normal profits. Their objective was to create the appearance of alluring success […] and cash out before the world discovered the truth.”
[On incentives] “The bankruptcy report spoke of “numerous failures inadequacies and breakdowns in the multilayered system designed to protect the integrity of financial reporting system at WorldCom, including the board of directors, the audit committee, the company’s system of internal controls and the independent auditors”. The problem, I would argue, was deeper, and touched not only WorldCom: the problem was with incentives – for the management, and for those who were supposedly watching over management.”
[On the subject of fines] “They accepted fines of unprecedented levels […] but, in most cases, only after being assured that their CEOs would not do [jail] time. […] in many cases it was not the CEOs but the companies that paid them; indeed, the fines imposed on corporations for such bad behavior represent a curious case where the victim is punished twice over. For ultimately, the shareholders – who have already been cheated by corporate management- bear the costs of such fines.“
[On executives’ greed and regulation] “The deregulation mentality made the suggestion of increased government regulation […] an anathema. What worried many were shareholder suits, which they viewed as simply reflecting the rapacious greed of lawyers, not part of a system of checks and balances against the rapacious greed of corporate executives.”
Joseph E. Stiglitz (1) served and later chaired the Council of Economic Advisers (CEA) during the Clinton Administration from 1993 to 1997. He was awarded the John Bates Clark Medal (1979) and he Nobel Prize in Economics (2001). After leaving the CEA he moved to the World Bank. He taught in the past at Stanford and now teaches in Columbia University. He also served at the OECD and several other positions to which he has been appointed throughout his career.
Stiglitz wrote “The Roaring Nineties” in 2003 to offer an insider’s view of economic policy making and the economic boom and bust of the nineties. I loved the book. I use to make some annotations and marks in the books I read. I counted the ones I made reading this book: 52.
Stiglitz is frank in admitting that all the focus that the Clinton administration had at the beginning of the term in passing laws to improve the living of the disfavored ones was suddenly put aside due to the mantra of deficit reduction. He openly regrets it several times throughout the book and offers some criticism on the administration he took part in and others before and after. Especially Reagan’s and Bush II’s.
Now, in 2014, there are many who brag about their seeing of the bubble that caused the financial crisis which burst between 2007-2009. It would be rather easy to see what they really said beforehand. See what Stiglitz published in 2003:
“The huge tax cuts of 2001 and 2003 were larger than the country could afford. The surplus of 2% of GDP of 2000 was converted in short order to a deficit of 5% of deficit – a huge turnaround in a short space of time. Americans were not saving enough to finance this deficit, and so the country, in effect, turned to the rest of the world. The country is living well beyond its means, borrowing more than a billion and a half dollars a day. […]
Households took on more debt because interest rates were low and they could afford it. But as interest rates inevitably rise as the economy strengthens, households will find it difficult to service their debt. This will be further aggravated in the years to come as large budget deficit means interest rates will be higher than they otherwise would be, putting an extra burden on the country. Many households will be forced into bankruptcy. Many will be forced to rein in their consumption. There is a strong risk that the real state bubble will break, or at the very least, prices will stagnate […] What is clear, however, is thar the Bush-Greenspan strategy, entailing greater reliance on low-interest rates and mortgage refinancing to maintain the economy through the period 2001-2004, and tax cuts for the rich, providing far less stimulus to the economy than would have been provided by investment tax credits or tax cuts for the poor, was a risky one, and has put the future of the American economy in jeopardy.” (emphasis is mine)
The risk then became an issue, which is still lasting 10 years later. This comes just in the preface of the book. Stiglitz specialization is information asymmetry. He gives some examples of such asymmetry in different passages of the book when analyzing errors, incentives, etc., in accounting, auditing, special interest agendas.
Let me quote some of the gems I had marked in his book:
“[…] one of the reasons that the invisible hand may be invisible is that it is simply not there”
“[…] “Voodoo” economics of Reagan, who somehow believed that by cutting taxes you could raise tax revenues […]”
“Developing countries were told to open their markets to every imaginable form of import […]. Meanwhile, we maintained stiff trade barriers and large subsidies of our own on behalf of U.S. farmers and agribusiness, thereby denying our market to the farmers of the Third World. […]
These were not the only examples of what struck those abroad as blatant hypocrisy.”
“We scolded the developing nations about their disrespect for intellectual property laws that we, too, had scorned in our days as a developing nation. (The United States didn’t get around to protecting the rights of foreign authors until 1891)”
“[…] the folly of the Reagan tax cuts. […] a theory scrawled on the back of a napkin, called the Laffer curve – after Arthur Laffer, who then was at the University of Chicago- which claimed that as taxes got higher and higher, people worked less hard and saved less […]”
“Over the years, I have become convinced that the confidence argument is the last refuge of those who cannot find better arguments; when there is no direct evidence that deficits directly promote recovery or adversely affect growth, then they do so because of confidence.”
“Fiscal responsibility was supposed to be the province of the conservative Republicans, but after twelve years of fiscal profligacy, a tax cut that Reagan said would pay for itself through energizing the economy but did not, it was left to Clinton to do the dirty work, without the help of the Republicans, who voted unanimously against Clinton’s deficit reduction plan. Their opposition confirmed the more diabolic interpretation of the Reagan tax cuts. They didn’t really believe in supply-side economics, the theory that the tax cut would spur the economy so much that tax revenues would actually increase. Instead, they knew that there would be shortfalls, and they hoped that the shortfalls would force a cutback in government spending. The true agenda was thus to force large cutbacks in the size of government […]”
“[…] the IMF was founded, under the intellectual aegis of Keynes: to provide with the money necessary for expansionary fiscal policy in an economic downturn. But the IMF has forgotten its original mission […]”
“The New Economy-the innovations which continue to fuel the productivity growth and form the basis of this country’s long-run strength depend on the advances of science, on researches at universities and research labs, who work sixteen-hour days and more in the tireless search to try to understand the world in which we live. These are the people we should have been rewarding, and encouraging.”
I think that with these excerpts you get a glimpse of the directness of the book. It touches economic policies, creative accounting and accounting standards, conflicts of interests, incentives, the case study of Enron, employment, the role of central banks, the danger of quick adoptions of deregulation, corporate hypocrisy, globalization…
I strongly recommend the reading of this book (about 380 pages).
There is something puzzling that we constantly found in the different restaurants we dined at in Greece: the inconsistent pricing of beer. Or rather, the consistent pricing of it in a different fashion as it is done in other places in the West.
Take a look at the menu below.
You may see that Alpha draft beer is sold in two quantities:
300mL for 2€ and,
400mL, for 3€ euros.
That yields a price of 6.7€/L for the 300mL and a price of 7.5€/L for the 400mL.
Read the previous line again.
Then, who would buy the larger quantity if it is sold at a higher price per litre (12.5% higher)? Normally, one would expect some discount linked to volume. Well, not in Greece with beer :-).
Pricing beer in Greece.
We found restaurants in which the differences in pricing were more striking but only took this picture.
Another puzzling fact which we didn’t record was that for a same beer (say Alpha) in most places they sold the bottled beer cheaper than the drafted one (for a same volume). Again this was surprising, as we normally see draft beer sold cheaper, and there are certainly cost advantages to selling draft beer. But then the difference in pricing strategy versus how it is done in the West could have been explained from the demand side (not the supply) if the Greeks value much more draft beer.
Taxes are often the subject of heated discussions. Nobody enjoys paying taxes, even if we understand that they’re needed to pay for some state services that otherwise we would not have.
People especially hate when taxes are raised. In Spain income taxes, VAT taxes and some other minor taxes or the cost of public services have been raised recently. In France there is a heated debate on whether the maximum personal income tax rate could be raised up to 75%. A similar heated discussion takes place in the USA about the effective taxes rate paid by the superrich, the top 1%, the top 0.01%… you name it.
You will hear people either claiming that taxing more the rich is what is to be done or that increasing taxes will not forever increase tax revenue collection (the famousLaffer curve); that investors, job creators, etc., will be deterred by the high taxes and take their wealth elsewhere.
Firstly, I am no expert on taxes.
However, seeing today’s tax rates levels (be it Spain, France or the USA), the heated discussions we witness and having had some conversations either with friends or colleagues on taxes, I thought it could be interesting to post in the blog some historical evolution of the different tax rates, just to put in perspective what is high taxes.
I have taken all the graphics from the Wikipedia and all refer to the case of the USA (the one for which there is always more data available). You can see below the evolution of personal income tax rate for the highest and lowest earners, of taxes on capital gains and corporate taxes.
Personal Income Taxes (what in Spain would be IRPF).
You can see in the picture below how the maximum tax rate was for some time above 90% (now is 35%). You can check yearly data on the different tax brackets in the Tax Foundation. In those years with brackets above 90%, maximum effective tax rates were around 70-88%.
“Historical Marginal Tax Rate for Highest and Lowest Income Earners” in USA, from 1912 to 2008 (by Guest2625)
Capital Gains Taxes.
You can see in the picture below how the maximum tax rate was for some time 35% (now is 15%). This is the tax that applies to most of the income of those superrich as they earn it via their investments.
Maximum Federal Tax Rate on Long Term Capital Gains (1972 – 2012) (by Guest2625)
Corporate Taxes.
These are the taxes on corporate profits. You can see in the picture below how the effective tax rate has been continuously decreasing from above 40% in the ’50s (now is under 20%).
US Effective Corporate Tax Rate 1947-2011 (by Guest2625)
Those were the rates.
Then there is a whole lot of studies proving either point or the other. That higher taxes provoke lower investment or the contrary. That higher taxes reduce tax collection or the contrary. That higher taxes reduce growth or the contrary. Pick your study and support your argument. You may have to look for one variable and hide another, pick a country and forget another, pick a decade and not the one before or after. It doesn’t matter, I guess any point can be proven.
Let me finish by sharing two more graphics, obviously handpicked, and a quote:
Top Capital Gains Tax Rates and Economic Growth 1950-2011 (by Leonard Burman).
Capital Gains Taxes and Real Investment (by Jared Bernstein).
“I have worked with investors for 60 years and I have yet to see anyone — not even when capital gains rates were 39.9 percent in 1976-77 — shy away from a sensible investment because of the tax rate on the potential gain. People invest to make money, and potential taxes have never scared them off.“
Take a look at the water counter in the picture below:
Water counter at hostel.
We found these water counters at the hostel we were lodged in Berlin. I immediately started taking note of how many litres I consumed in each of the showers I took. First one:
I checked in the internet and found references of average consumptions for showers between 80 and 120 litres. The following days I tried to save some water (of course without compromising the cleaning part :-)). The minimum consumption I had was of 34L, the rest in the end were around 42L.
In the process I discussed with Luca whether hotels could incentivize in some ways (other than displaying the counter at our sight) the saving of water by the guests. We thought of possible messages in the way of “the average guest consumes 100L per shower, see if you can use less water! Do it for the planet!”, or whether some discounts / surcharges could be offered / imposed to those consuming less / more water.
However, I checked water prices in France and in Toulouse and it is around 3.3€ per cubic metre (m3). That is, in 5 days, having seen the counter and having tried to minimize water consumption all I saved was about 0.38 m3 or about 1.25€… this is economically meaningless in comparison with the hotel bill.
At those prices, I guess all we could do is trying to save water out of our consciences and not driven by an economic drive (the same level of saving I achieved could mean ~35€ a year per person).
Tabla comparando tramos del impuesto sobre la renta en Francia y España (ref. ingresos de 2012)
Usaré para hacer la comparación el mismo ejemplo que en el post del año pasado.
Aclaración básica: la forma en que se interpretan los tramos es la siguiente. Por ejemplo, para un salario bruto de 35.000€, en Francia los primeros 5.983€ están exentos de retención (5.050€ en el caso de España), los siguientes 5.933€ (diferencia entre 11.896€ y 5.963€, en el caso francés) tienen una retención del 5,5%, los siguientes 14.524€ (diferencia entre 26.420€ y 11.896€, en el caso francés) tienen una retención del 14%, y así hasta llegar a los 35.000€.
En resumen, para un salario bruto de 35.000€, en Francia se pagarían 4.934€ (un 14,1%) y en España, 8.520€ (un 24,3%). En Francia se pagarían por tanto 3.586€ menos en impuestos sobre la renta (un 10% menos).
Como veis, en Francia el impuesto sobre la renta (“IRPF”) es menor en cada tramo. La contribución que hacen los trabajadores a la Seguridad Social es sin embargo mayor (algún día pondré esa comparación), con lo que al final las cantidades son similares.
En el post del año pasado la cifra de impuestos en España resultaba 8.131€ (un 23,3%) frente a los 8.520€ (24.3%) de este año. Es decir, para alguien con un salario bruto de 35.000€ la subida de impuestos se traduce en un ~1%, o algo menos de 400€ (que ya habrá notado en las retenciones que practican las empresas).
***
(*) Mantendré la entrada original, con la tabla desactualizada, para que quede a modo de histórico y se pueda comparar con la nueva.
En el último post publiqué un cálculo de cuáles fueron los ingresos medios en España en 2007 a partir de las declaraciones del IRPF de aquel año. El resultado, 17.116€, debe ser algo inferior a los ingresos medios reales, debido a los efectos de las deducciones que se aplican a la hora de calcular la declaración de la renta (ver NOTA en dicho post).
En este post, sin embargo quiero usar aquellos datos para poner un ejemplo de media, mediana y moda, como epílogo a un comentario de otro post que publiqué la semana pasada (sobre como unos datos de ingresos en EE.UU. se reflejaban en un periódico) y una conversación con un compañero de trabajo.
Usaré la siguiente gráfica, que resume el post anterior:
Declarates de IRPF en España en 2007 por tramo de ingresos.
En la gráfica se puede ver:
la cantidad de declarantes por cada tramo de renta (columnas en gris),
la “media” de ingresos calculada para cada tramo (líneas negras)
la media de ingresos del total de declarantes (línea roja), 17.116€.
la “moda” de ingresos, esto es, el dato que más se repite, y que a falta de más datos cogeríamos la media del tramo donde más declarantes hay, i.e., 11.755€ (línea negra gruesa).
la “mediana” que se encuentra en el percentil 50 y separa la mitad de declarantes que más ingresos declara de la mitad que menos ingresos declara, en este caso y a falta de más datos dentro de cada tramo, de nuevo habría que asimilarla a la media del tramo donde más declarantes hay, i.e., 11.755€. (Por encima de ese tramo, 12-21k€, declaran 6,2 millones de personas y por debajo 7,3 millones).
Luego en España, en 2007, y dado que la media del total de declarantes (17.116€) es bastante superior que la mediana (11.755€), aun estando ambas dentro del mismo tramo (12-21k€ – ver NOTA del post anterior), más de la mitad de los declarantes obtuvieron ingresos por debajo de la media (posiblemente la cifra estuvo en torno al 60%).
Hace unos días publicaba una serie de tablas que recopilé 2007 sobre la economía española. En una de ellas aparecían datos sobre la declaración del impuesto sobre la renta de las personas físicas (IRPF) de 2007: número de declarantes en cada tramo, importe abonado por los declarantes de cada tramo, media por declarante…
El primer post a publicar a partir de esa tabla era inmediato: ¿cuál era el salario medio en España en 2007 a partir de los datos de la declaración del IRPF?
Primer paso: encontrar cuales eran los tramos del IRPF del año 2007 (hay que notar que estos tramos son diferentes a los 2010, que publiqué en otro post, y a los de 2012 – que tendré que comparar algún día con los de Francia en 2012).
A partir de los tramos, se puede ir calculando el importe abonado por los declarantes en cada tramo; es decir, alguien que declaró 35.000€:
no pagó por los primeros 5.050€ (“mínimo vital”).
pagó un 24% por los 12.310€ entre el mínimo vital y los 17.360€ del límite del tramo.
pagó un 28% por los 15.000€ del siguiente tramo.
pagó un 37% por los 2.640€ del siguiente tramo (de 32.360€ a sus 35.000€).
Según lo que los declarantes abonan en cada tramo y el tipo en cada tramo, se pueden calcular los ingresos medios declarados en 2007 para cada tramo y para el total. Es decir, el ingreso medio en España en 2007 para los casi 19 millones de españoles que completaron la declaración de la renta. Adjunto debajo la tabla resultante:
Ingresos medios en España en 2007 calculados a partir de los datos de la declaración del IRPF de 2007.
El resultado: el ingreso medio declarado en 2007 fue de 17.116€ (ver nota).
El paso siguiente también es obvio, buscar entre las fuentes y dar con el dato de 2010, que debería estar disponible.
***
NOTA: En la tabla incluyo un par de comentarios. En el segundo menciono que tras realizar el cálculo para los tramos de 12 a 21k€ y de 21 a 30k€ resultan unos ingresos medios menores que el mínimo del tramo. Este resultado es incoherente. Entiendo que debe ser por deducciones que el declarante obtiene por su situación personal (hipotecas, personas a su cargo), por tanto, este método es insuficiente para obtener un resultado final, ya que dichas deducciones pueden minorar el importe pagado en cantidades no despreciables en los tramos inferiores (para los tramos superiores, las deducciones suponen un porcentaje menor).


")


