Boeing 787 orders vs. cancellations

I read yesterday the first article about delays in 787 deliveries in 2013 due to the grounding of the fleet. With the investigation of the batteries issue taking already a month, it was evident that these delays were going to happen.

I have not yet read anything in the specialized or business press about cancellations. However, taking into account that when the 787 program started announcing 3-month delays from Q3 2007, cancellations started to pile, I guess that this time it will not be very different.

I checked the information of orders and cancellations from Boeing website.

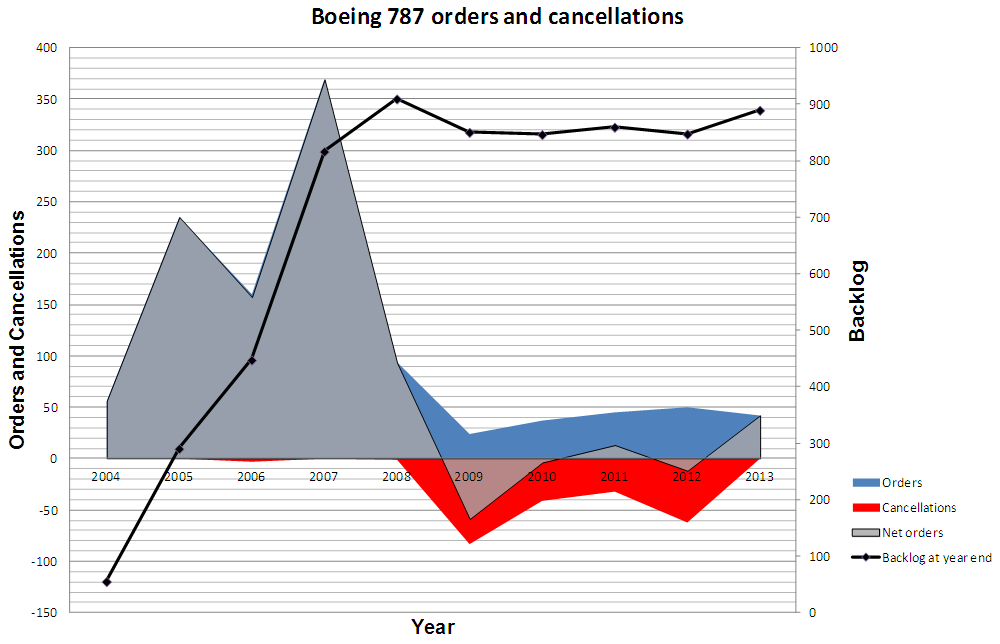
Since 2004, Boeing has received a total of 1,112 787 orders. Out of these, 222 orders were later on cancelled; mostly between 2008 and 2012. Now there are still 890 firm orders (with about 50 of those aircraft already delivered). As a summary, find the graphic below:

Boeing 787 orders and cancellations

Boeing 787 orders and cancellations

1 Comment

Filed under Aerospace & Defence

Boeing commercial aircraft discounts (update for 2012)

A week ago, Boeing released 2012 results [PDF, 223KB]. The company reported revenues of almost 81.7bn$601 commercial deliveries and 1,203 net orders for its commercial aircraft. All these were widely reported by the media and mean a great year 2012 for Boeing (with increases in these metrics from 20 to 30%).

Last years, I wrote in some posts what was my estimate of Boeing discounts: the relation between what is announced by the press, what appears in its list prices and sometimes as backlogs and what it is indeed computed into the profit and loss account. In this post I wanted to update, if necessary, the figure I calculated for the average discount of Boeing.

Most of the necessary information can be found in its website. Boeing list prices can be found here.

The number of gross and net orders (after cancellations) year by year can be found here.

Last year deliveries can be found in the report of financial results (or here). From there we can also deduct the figure of Boeing Commercial’s sales of services. That is not directly reported but can be deducted (all Boeing services-related sales are reported as well as Boeing Capital Corporation division and Boeing Defense’s “Global Services & Support” unit)

As in the post of last year:

  • I needed to make one assumption: new orders come with a 3% down payment in the year of the booking, while the remaining cost I assumed that was paid on the year of delivery (for simplicity I didn’t consider more intermediate revenue recognition milestones linked to payments, the 3% figure was taken from the AIAA paper “A Hierarchical Aircraft Life Cycle Cost Analysis Model” by William J. Marx et al.). [1]

Having put all the figures together, the calculation is immediate. Boeing Commercial Aircraft revenues in 2012 (49,1bn$) are the sum of:

  • the discounted prices times the delivered aircraft in the year (including possible penalties from delays),
  • less the down payment of the current year delivered aircraft, as the down payment was included in previous years results,
  • plus the down payment of current year net orders (this year’s calculation has been again a bit tricky as it included 737NG deliveries and 737 MAX orders),
  • plus services revenues (about 1.4bn$ from the commercial aircraft unit – calculated, not reported).

The discount figure that minimized errors last year was 41%. Using this figure, the error obtained this year in relation to Boeing Commercial Aircraft reported revenues is 7.5%, much too high. The best estimate for last years average discounts were: 41% for 2011, 39% for 2010 and 38% for 2009.

The updated figure (which minimize errors for 2012 down to 0.4%) for the discount for Boeing commercial aircraft is 45% [2].

The explanation I can find for that increase shall be linked the built-in penalties for 787 (net orders for 2012 being -12 a/c) and 747 delays (1 single net order) into revenues plus the launch of a new aircraft, 737 MAX (forced by A320neo sales success in 2011).

[1] Two years ago, I received a comment from the analyst Scott Hamilton on the level of downpayments. He mentioned they could reach up to 30%. I tried this time to compute the calculation using that input, though the figures of discounts to be applied each year to minimize errors would have to be even higher, over 50% (!), thus I stayed with the 3% used in the above-mentioned published paper to stay on the conservative side.

7 Comments

Filed under Aerospace & Defence

Certificate from Stanford Venture Lab

In a previous post I discussed about online education. Among the final reflections that I shared, one was about the certificates:

Certificates: all three courses are not official Stanford courses, though the instructors send a “Statement of Accomplishment” after satisfactory performance and completion of the course. I guess that with time more institutions will go towards this model. I even think that official certificates will be delivered for these kind of online education.

I have started to receive the certificates from those courses that I completed. The first one in arriving was from “A Crash Course on Creativity“. Note that in fact it is called “Certificate of Accomplishment”, not being an official certificate from Stanford:

Statement of Accomplishment of "A Crash Course on Creativity", Stanford Venture Lab.

Statement of Accomplishment of “A Crash Course on Creativity”, Stanford University Venture Lab.

You may note the remark at the bottom of the certificate:

PLEASE NOTE: SOME ONLINE COURSES MAY DRAW ON MATERIAL FROM COURSES TAUGHT ON CAMPUS BUT THEY ARE NOT EQUIVALENT TO ON-CAMPUS COURSES. THIS STATEMENT DOES NOT AFFIRM THAT THIS STUDENT WAS ENROLLED AS A STUDENT AT STANFORD UNIVERSITY IN ANY WAY. IT DOES NOT CONFER A STANFORD UNIVERSITY GRADE, COURSE CREDIT OR DEGREE, AND IT DOES NOT VERIFY THE IDENTITY OF THE STUDENT.

Some more questions to debate:

  • Would that stop you from taking a course?
  • If you had not completed some other studies before: would you go for these courses? Would you build your student records based on this kind of certificates?
  • If you were an employer: would you recruit somebody which key skill was acquired through such kind of course? (“it does not verify the identity of the student”)

2 Comments

Filed under Education

Athletic World Records vs. my times (speed vs. distance in log plot)

Two weeks ago I published a post where I showed a graphic of the different world records in athletics with the speeds and paces.

I received a comment from Uwe, a reader of the blog, suggesting to plot it using a logarithmic scale. At first, I wanted to show how the long distance runners could almost keep a speed (between 20.5 and 23.8 km/h) for distances from 5 kilometres to 42, a marathon. However, Uwe convinced me to make the plot and here it is:

Athletics World Records vs. my times (speed) - logarithmic scale for the distances

Athletics World Records vs. my times (speed) – logarithmic scale for the distances.

In this view, what it is interesting is to appreciate the different slops of the lines connecting the different records. There you can see how:

  • 100m and 200m races are fully anaerobic where Usain Bolt is capable of maintaining an average speed of above 37.5 km/h. You can see in the explanation in the Wikipedia how these two races (both lasting below ~30 seconds) use as energy source high energy phosphates.
  • races from 400m to 1 km are still a high intensity activity, with some anaerobic component, though another energy source enters into play: anaerobic glycolisis. And as we have heard often in descriptions about 400m races, the consequence of rapid glucose breakdown is the formation of lactic acid.
  • from then (1.5 or 2km) on (up to 42km) professional runners are able to keep a high speed out of aerobic metabolism (using adenosine triphosphate, ATP). Of course, speed decreases with distance, but from the 26.2 km/h of a 1,500m to the 20.5 km/h of a marathon the speed decrease is of -22% for a race 28 times longer!
  • for ultramarathons (over 42k) speed starts decreasing at a higher pace, though Wikipedia only offered the 100k time. Probably more data can be found in the web to try to find with more accuracy up to which distance the long distance stable pace could be maintained.

Uwe, you were certainly right. This view offers another very interesting perspective to the game :-).

2 Comments

Filed under Sports

Pregnant

Dear readers, I am pregnant!

Well, to be precise, it is Luca who is expecting a baby!

Stork bringing the baby to Toulouse (design by Jaime, future uncle).

Stork bringing the baby to Toulouse (design by Jaime, future uncle) (1).

If everything goes well, junior will enter into service by the beginning of August (I cannot guarantee that there won’t be delays…). Engineering and Programme Management (I) have done their job, now it’s up to Industrial and Delivery Centre (Luca) to complete the project (we swear that Procurement was not involved!).

—-

(1) Clarification for those not coming from Spain: the tradition there says that children are not only brought by a stork, but also that it brings them from Paris.

(2) We accept suggestions for the name, both female and male. Even more, we’re even thinking of setting up a contest; but please suggest a name only if you think it can top “Javier”.

(3) For those worried about the legal framework surrounding the coming child: we are already PACSed AND engaged

25 Comments

Filed under Miscellanea

Daily cost of Boeing 787 fleet grounding? (number play)

I am following relatively closely the news related to the grounding of Boeing 787 world fleet due to the recent issues that 2 of the operating aircraft had in service. I was wondering how much could Boeing be penalised by this situation.

Then, a couple of days ago I started seeing estimates (up to 5bn$?!), so enjoying playing with numbers as I do, I wanted to make up my figures before reading the explanation I am looking for somewhere else. Let me share the number play with you.

I have read news pointing at a solution based on new batteries, which certification could extend until 2014! Well, hopefully it doesn’t take that long, but since we don’t know for how long the fleet is going to be grounded and we also don’t know what the final fix is going to be, what I am interested at this moment is in trying to guess the cost per day of the grounding of the fleet.

Let me explain the assumptions I am going to take and where do they come from:

  • aircraft grounded: 50 (Boeing deliveries).
  • average seating: 210-250 seats for -8 (a/c delivered) and 250-290 for -9 (seating numbers from Boeing; deliveries from Wikipedia).
  • revenue per passenger: here, instead of doing an extensive research, I based the calculation on a previous research made by Air Insight for a report about Air India potential claim for 787 delays (the article is from one year ago).
    • $234 per flight hour for first class (using a 75% load factor),
    • $136 per flight hour for business class (80%),
    • $67 per flight hour for economy class (85%).
  • seating per class: using the information from United as reported by SeatGuru for the
  • 787-8: 36 + 72 + 111 (1) (for a total of 219 pax).
  • flight hours per day: Air India was flying between 11 and 11.78 FH/day according to Air Insight. Ethiopian was said to be flying about 14 FH/day. I’ll take an average of 12 flight hours per day.

With all these assumptions, the daily cost of B787 grounded fleet is: ~12.3 millon dollars / day.

Partial results of the calculation are:

  • average revenue per flight hour, ~20,500$;
  • average daily revenue of a 787, ~245k$.

Taking into account that the fleet has been grounded for already 2 weeks, the cost so far is in excess of 170m$, not much compared to Boeing earnings (to be released today). But if the solution and certification process takes really until 2014, this cost would be in the order of 4.5bn$ (close to the 5bn$ figure pointed by Jefferies & Co. analyst).

Final remarks. Remember that this number play just tries to guess what is the revenue loss from not flying 787s. It doesn’t take into account the cost of fixing the problem, or whether the same routes are flown by other aircraft models and to what extent Boeing might or might not be penalised (in relation to revenue loss? profit loss?). This number play also does not take into account potential financial impact on further deliveries being postponed.

***

(1) Taking estimate of revenues and load factors from Air India and seating numbers from United already introduces some error.

Note: After completing this post, I saw the following similar estimate in Reuters published 2 weeks ago: 1.1m$ per day for a fleet of 17 a/c, the case of ANA.

4 Comments

Filed under Aerospace & Defence

Strategy 101 at play in EADS

EADS announced last month, on the 5th of December an overhaul of its Governance and Shareholding Structure. See the press release in which it was announced.

That press release had 7 key points. Each of them would deserve a long discussion. To be honest, I have had long discussions about some of them with colleagues.

The week after the release was made public, I had lunch with a couple of former colleagues, both former strategists and now retired. When discussing together our impressions of the changes and implications, we first talked about the share buy-back (part of the emphasis is mine):

2. Share buy-back

Subject to market conditions and to the approval of the Extraordinary General Meeting, EADS intends to implement a share buy-back program and subsequent cancellation of up to 15 percent of the outstanding EADS shares, divided into two equal and simultaneous tranches bearing the same terms and conditions:

– A first tranche of up to 7.5 percent, which shall be open to all of EADS’ shareholders, other than the parties to today’s agreement; and

– A second tranche of up to 7.5 percent, which shall be reserved exclusively for Lagardère SCA up to 5.5 percent. If the size of the tranche is higher than 5.5 percent, SOGEPA and SEPI will have the right to tender the remainder (based on their pro rata ownership of EADS shares unless they agree otherwise). In the event that SOGEPA and SEPI do not exercise their right, Lagardère SCA could take up to the full amount of the tranche. Finally, in the event that this tranche is not fully tendered by the above parties, Daimler AG will have the right to participate up to the full unused amount of the tranche.”

I have already shared on a previous post Buffett’s view about share buy-backs, thus I will not comment further about in this post.

Then, my senior colleague raised attention to another part of the release, to which I had not paid much attention the first time I read it:

“Certain specific French and German national security interests will be protected through the creation of “national defence companies” holding sensitive military assets, and including the rights of France and Germany to consent to three outside directors to the board of their respective “national defence companies”. Two of such directors of each “national defence company” shall be members of the EADS Board.”

In the release it is explained that France, Germany and Spain have agreed on a capped government shareholding and will have reciprocal pre-emption rights. The composition of the Board of Directors is changed, to 12 directors, with at least 8 independent and 4 coming from these “national defence companies” (2 from each).

Just as a remark, there is no Spanish “national defence company” holding sensitive military assets. There is not an agreement on any director coming from any such Spanish company, though some of the 8 independent ones could be Spanish.

Today two names appeared on the press:

As my former colleague said, let’s play attention to these moves, especially to the second kind of moves. We are going to at least learn a lot and even enjoy the process. Strategy 101 at play in EADS.

—-

PD: To put the icing on the cake, let me finish the blog post as the press release is finished:

***************

“In the context of this change of governance, and in a separate agreement with the French State, subject to the consummation of the above transactions, EADS has undertaken to consult with the French State before exercising its voting rights at the general meeting of shareholders of Dassault Aviation and has granted the French State a right of first offer / first refusal in case of the sale of all or part of its stake in Dassault Aviation.

The parties to today’s agreement are EADS, Daimler AG, DASA, Lagardère SCA, SOGEPA, Sogeade, KfW and SEPI.”

Leave a comment

Filed under Aerospace & Defence

Buffett on shares buy back by companies

I was reading last weekend Warren Buffett’s 1980 letter to Berkshire Hathaway shareholders, when I encountered the following passage about shares buy back by a company (emphasis is mine):

One usage of retained earnings we often greet with special enthusiasm when practiced by companies in which we have an investment interest is repurchase of their own shares. The reasoning is simple: if a fine business is selling in the market place for far less than intrinsic value, what more certain or more profitable utilization of capital can there be than significant enlargement of the interests of all owners at that bargain price? The competitive nature of corporate acquisition activity almost guarantees the payment of a full – frequently more than full price when a company buys the entire ownership of another enterprise. But the auction nature of security markets often allows finely-run companies the opportunity to purchase portions of their own businesses at a price under 50% of that needed to acquire the same earning power through the negotiated acquisition of another enterprise.”

Then, sometimes, we see companies that decide to hold excess cash while waiting for opportunities of what to do with it, or to protect themselves against uncertainty, etc. Some do as Buffett says and buy back at minimum prices. Others do the contrary, they buy back shares at maximum prices.

There is always an explanation to taking one option or the other, even if the final reason is not always told, understood…

2 Comments

Filed under Investing

Our investment fund in 2012

It is 4 years now since Luca and I started investing together. This is the 3rd year publishing this post in which I explain how our investments fared along the year. In previous years’ post I had explained how we had adopted for our personal investments the same approach mutual open-ended funds have.

Brief recap for newcomers:

As I explained last year, we had to define a net asset value per share (valor liquidativo de la participación) at the beginning of the period. This net asset value per share rises and decreases as the aggregate share prices of the stocks in the portfolio rise or decrease. When an investment fund informs about its yearly results it is referring to the performance of this net asset value per share.

Each time that there is an addition of capital (new investments, in this case by Luca or me) it is treated as an issue of new shares to ourselves. It doesn’t matter that we are the only “shareholders”. Depending on whether the net asset value has increased or decreased we are acquiring the new shares at a higher or lower price than we acquired the previous ones. Exactly as it works in a fund.

Let’s go to this years results: How did the year 2012 go? As last year, this is going to be a humbling exercise :-).

In 2012 we have not been very active investors, not doing many transactions nor adding lots of funds to the investments (with a wedding in sight we had a preference for cash). We mainly held previous investments and sold a couple of positions which already earned what we expected (1).

During 2012 I took note of the fund value about 30 times, so we could get an idea of how the fund evolved. As you may see in the graphic below, the net asset value per share at the beginning of 2012 was 47.28€ while at the end it fell to 44.63€, that is -5.6%. This was the performance of the fund in 2012 (again not good enough to sell subscriptions to the fund! :-) ).

"J&L" investment fund 2012 performance (built in Google spreadsheet linked to Google Finance data, thanks to a friend's invaluable suggestion).

How does it compare with the main indexes?

  • S&P 500 ~ +13.41% (this is the target index)
  • Dow Jones ~ +7.26%
  • NASDAQ ~ +15.91%
  • IBEX 35 ~ -4.6% 
  • Euro Stoxx 50 ~ +13.65%

The gains of the fund since its creation in January 2009 have been+53.69%, with a compounded annual gain of +11.3% (remember this always refers to the net asset value per share – marked by the first 2 positive years – and cash gains cannot be directly derived from the net asset value performance times the total assets).

Two years ago, I introduced the comparison with leading Spanish value investing fund managers from Bestinver (2). Let’s do the exercise again:

  • Bestinfond ~ +16.52%;
  • Bestinver Internacional ~ +16.89%;
  • Bestinver Bolsa ~ +14.88%.

All in all, 2012 has been a good year to present general results, except in Spain and for us, due to some shipping and mining stocks that didn’t fare well in 2012. Let’s see how they go in the coming years.

I’ll keep you informed next year of this year’s results.

—–

(1) Unhappily we are not any longer shareholders of Pzifer, with its bluish star pill

(2) Disclaimer: Since sometime in 2011, we have also positions in Bestinver (which we increased in 2012), though I don’t get any fees for promoting it in the blog. (Our positions with Bestinver are excluded from the calculations of “J&L” fund to allow for clean comparisons).

NOTE: “J&L fund” numbers are pre-tax of capital gains realized, include dividends (twice taxed) and are net of transaction costs & brokerage commissions.

1 Comment

Filed under Investing

My 100th loan with Kiva

Few days ago I gave my 100th micro credit with Kiva. This particular credit went to Philomene:

Philomene (image from Kiva).

“Philomene is 48 years old, married and has five children, ages 8 to 19. Her husband is a builder. She wants a loan to buy more fruits to sell, such as yellow bananas and passion fruit. The profits from savings will be used for paying children’s school fees.”

I got to know about Kiva from my friend Bruno at the end of 2008. I immediately liked the idea and I gave my first loan through it soon after, in January 2009.

The idea is very simple: giving micro credits via internet to small entrepreneurs in developing countries. Kiva facilitates the process establishing a website to channel the funds and creating network with local organizations which will disburse the money and collect repayments.

Since what you give is a credit, when it is paid back you can re-lend the money, thus, the same 25$ may be used by several entrepreneurs along the years. See my case:

Loan count since 2009.

Loan count since 2009.

The fact that I have given 101 credits of 25$, doesn’t mean I have dedicated 2,525$ in these 4 years. I have dedicated to Kiva just above 550$. With them I was able to lend and re-lend up to above 100 credits. Now I still have close to 400$ in outstanding credits (being re-paid), after having donated some 130$ to Kiva to help with their operating costs and having lost just 28.19$.

I want you to take a second to think what do those 28$ lost mean. The default rate along these 4 years in my case has been 1.5%, this is close to nothing. Take into account Western countries mortgage default rates: close to 10% in Spain, and though lower in USA it reached over 5% a few years back.

Of all the loans that should have already been paid (75) just 3 ended with a loss. In one I lost less than half of the 25$ and in other 2 thirds. The entrepreneurs came from Africa and I am not upset by not having gotten back 28$ from them. I just hope that their situation improved since the time they were forced to default. With the 3rd credit which ended in loss, I lost 0.06$… due to currency exchange, meaningless.

Do you want to know some more statistics?

See below a map with coloured countries being the ones in which a recipient of one of my credit lives:

My "Lending by Country" map.

My “Lending by Country” map.

  • In 67% of the cases the recipient of my loans are women (see Forbes article about higher ROI when investing in women).
  • The countries in which I have given more credits: Peru (see the story about one of the entrepreneurs there that I visited), Uganda, Kenya, Rwanda, Philippines, Pakistan…
  • Regarding sectors: agriculture takes 30.7% of my credits, followed by food (22.8%), manufacturing (13.9%), retail (10.9%), education (6.9%)… (I would like to give more credits for education, but within Kiva there are not so many displayed; to cover that need I collaborate with another organization, Vittana).
  • I told you that I was introduced to Kiva by a friend. I also sent many invitations and some gift cards to friends; 6 of my friends accepted them.

These were my first 101 loans. Loans that change lives

1 Comment

Filed under Helping others