The Musée de l’Air et de l’Espace, in Le Bourget (north of Paris), is yet another great aerospace museum. It reminded me very much to the Aviodrome (The Netherlands) in the chronological point of view of the visit and the local aspect to it (1), paying special attention to French aviation pioneers, flying aces, French fighter aircraft, etc. This is possible, as the role France has played in the development of aviation is, no doubt, crucial.
You may see the distribution of the museum and its galleries in the plan below:
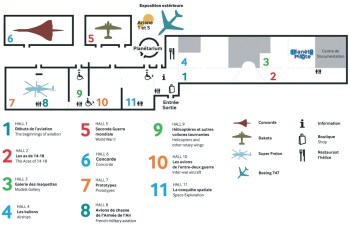
Plan of the museum.
I will now list some of the things that in my opinion make this museum unique (I will leave some anecdotes or details to future blog posts), accompanied by the respective pictures.
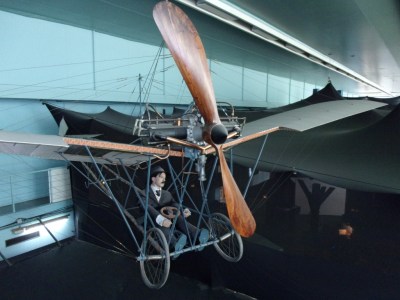
Model of Alberto Santos Dumont’s Demoiselle (1908).
Alberto Santos-Dumont was a Franco-Brazilian aviation pioneer (2) who with his 14-bis, “Oiseau de proie“, on the 23rd of October 1906, in Paris, performed the first officially witnessed unaided takeoff and flight by a heavier-than-air aircraft. In the picture above you can see him aboard another of his early models, a Demoiselle from 1908.
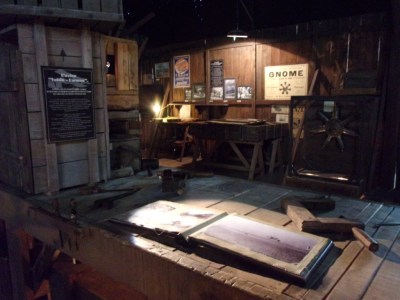
Workshop of the brothers Voisin (L’Atelier des Freres Voisin).
Some of the construction pioneers at the time were the Voisin brothers. The museum has model of how an aircraft construction workshop could look like at the time, “L’Atelier des FrèresVoisin” (this reminded me of the William E. Boeing Red Barn at the Museum of Flight in Seattle, see a post about it here).
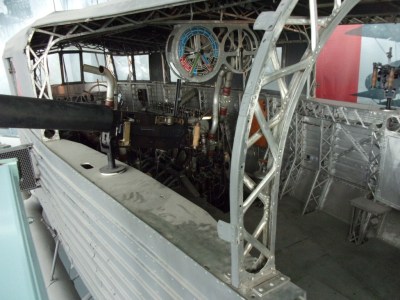
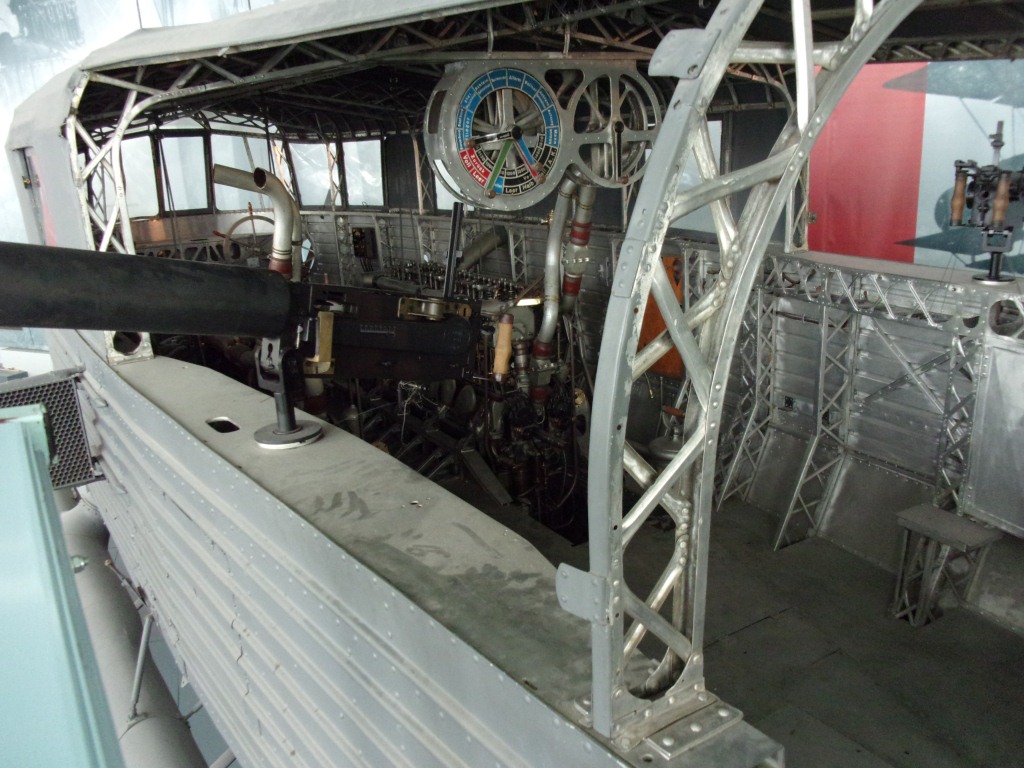
Nacelle of a dirigible Zeppelin LZ 113.
Not everything in aviation are heavier-than-air machines, above you can see the inside of a nacelle of a Zeppelin LZ 113 used in war operations.

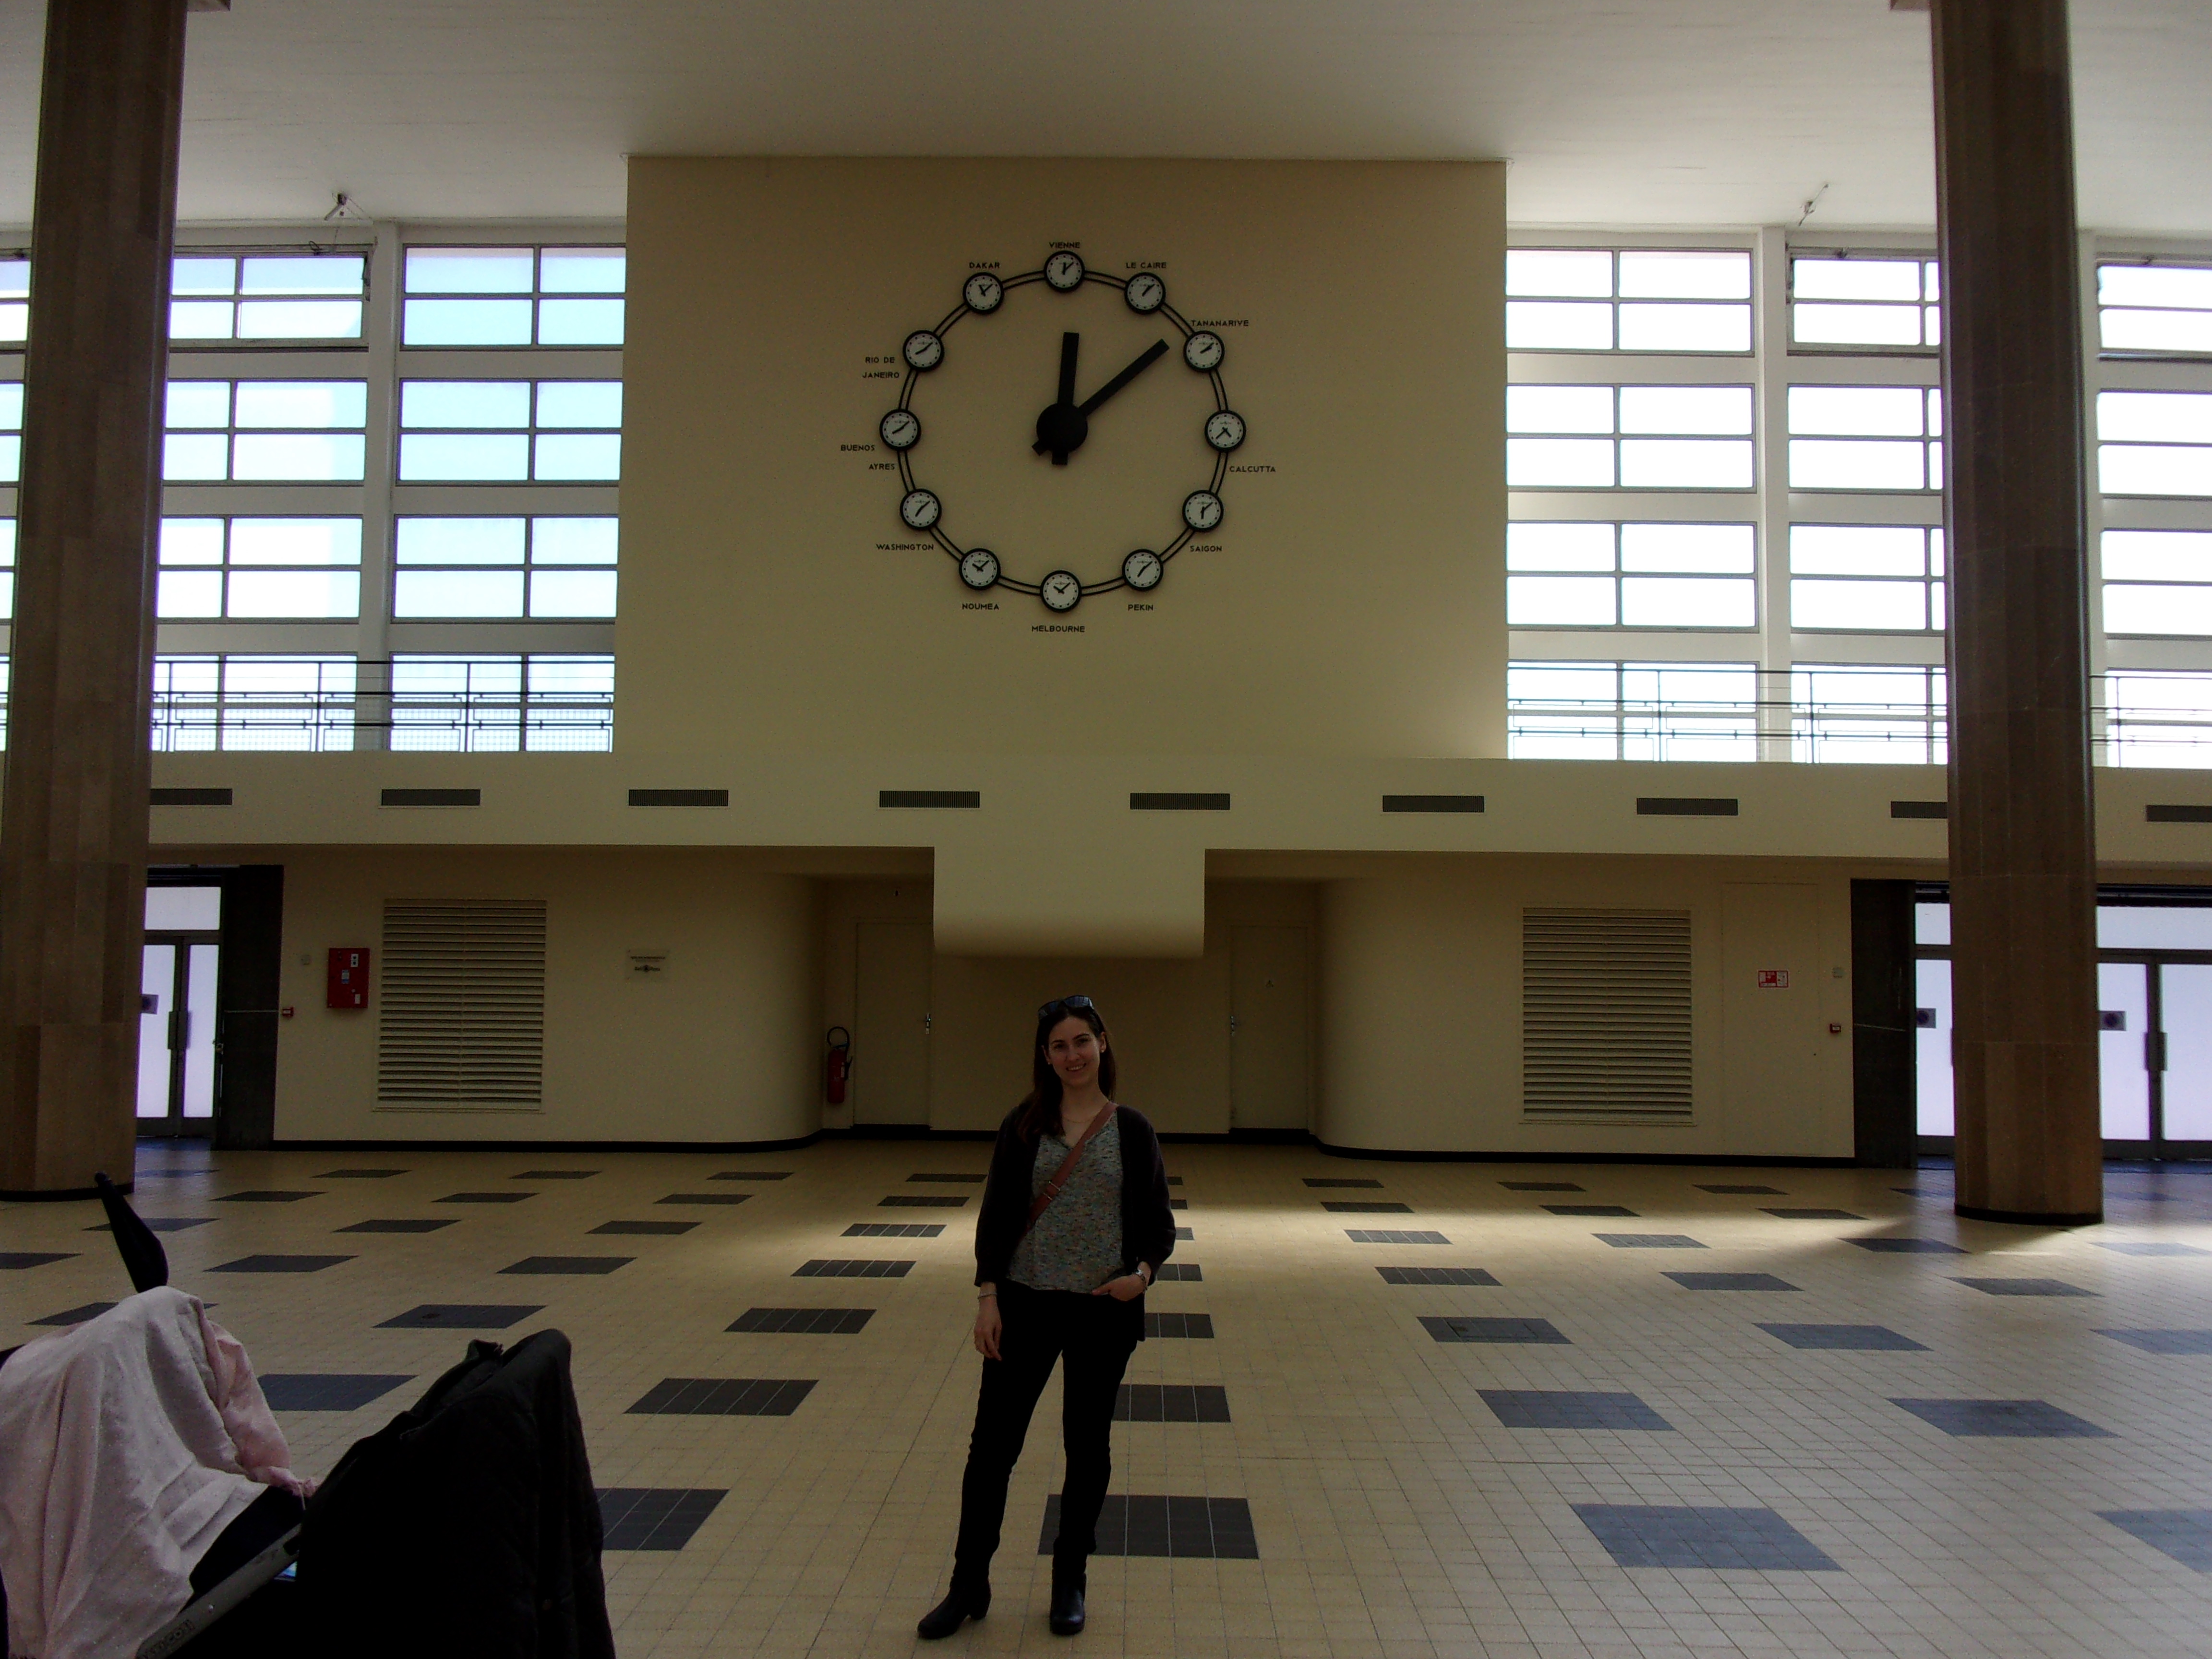
Old Le Bourget airport hall (“8 columns hall”).
Le Bourget was the first civil airport in Paris, opened in 1919. It was in Le Bourget where Charles Lindbergh landed his Spirit of Saint Louis in on the 27th May 1927 when he first crossed the Atlantic Ocean. The museum today occupies part of the old airport. In the picture above you may see the main hall, designed by the architect Georges Labro in a tender made in 1935 the ministry of aviation. The building was inaugurated in 1937 (this hall reminded me of Berlin Tempelhof, you may see a post I wrote about it here).
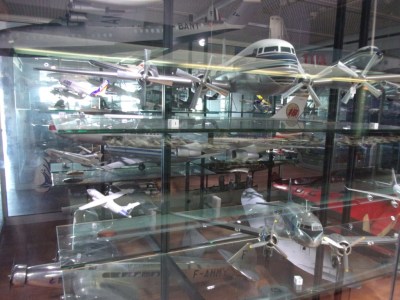
Models gallery.
The museum includes an aircraft models gallery. As a collector of models, I liked to spend some time wandering through these models. It also helps to test your own capabilities as a spotter without having to walk or wait a lot.

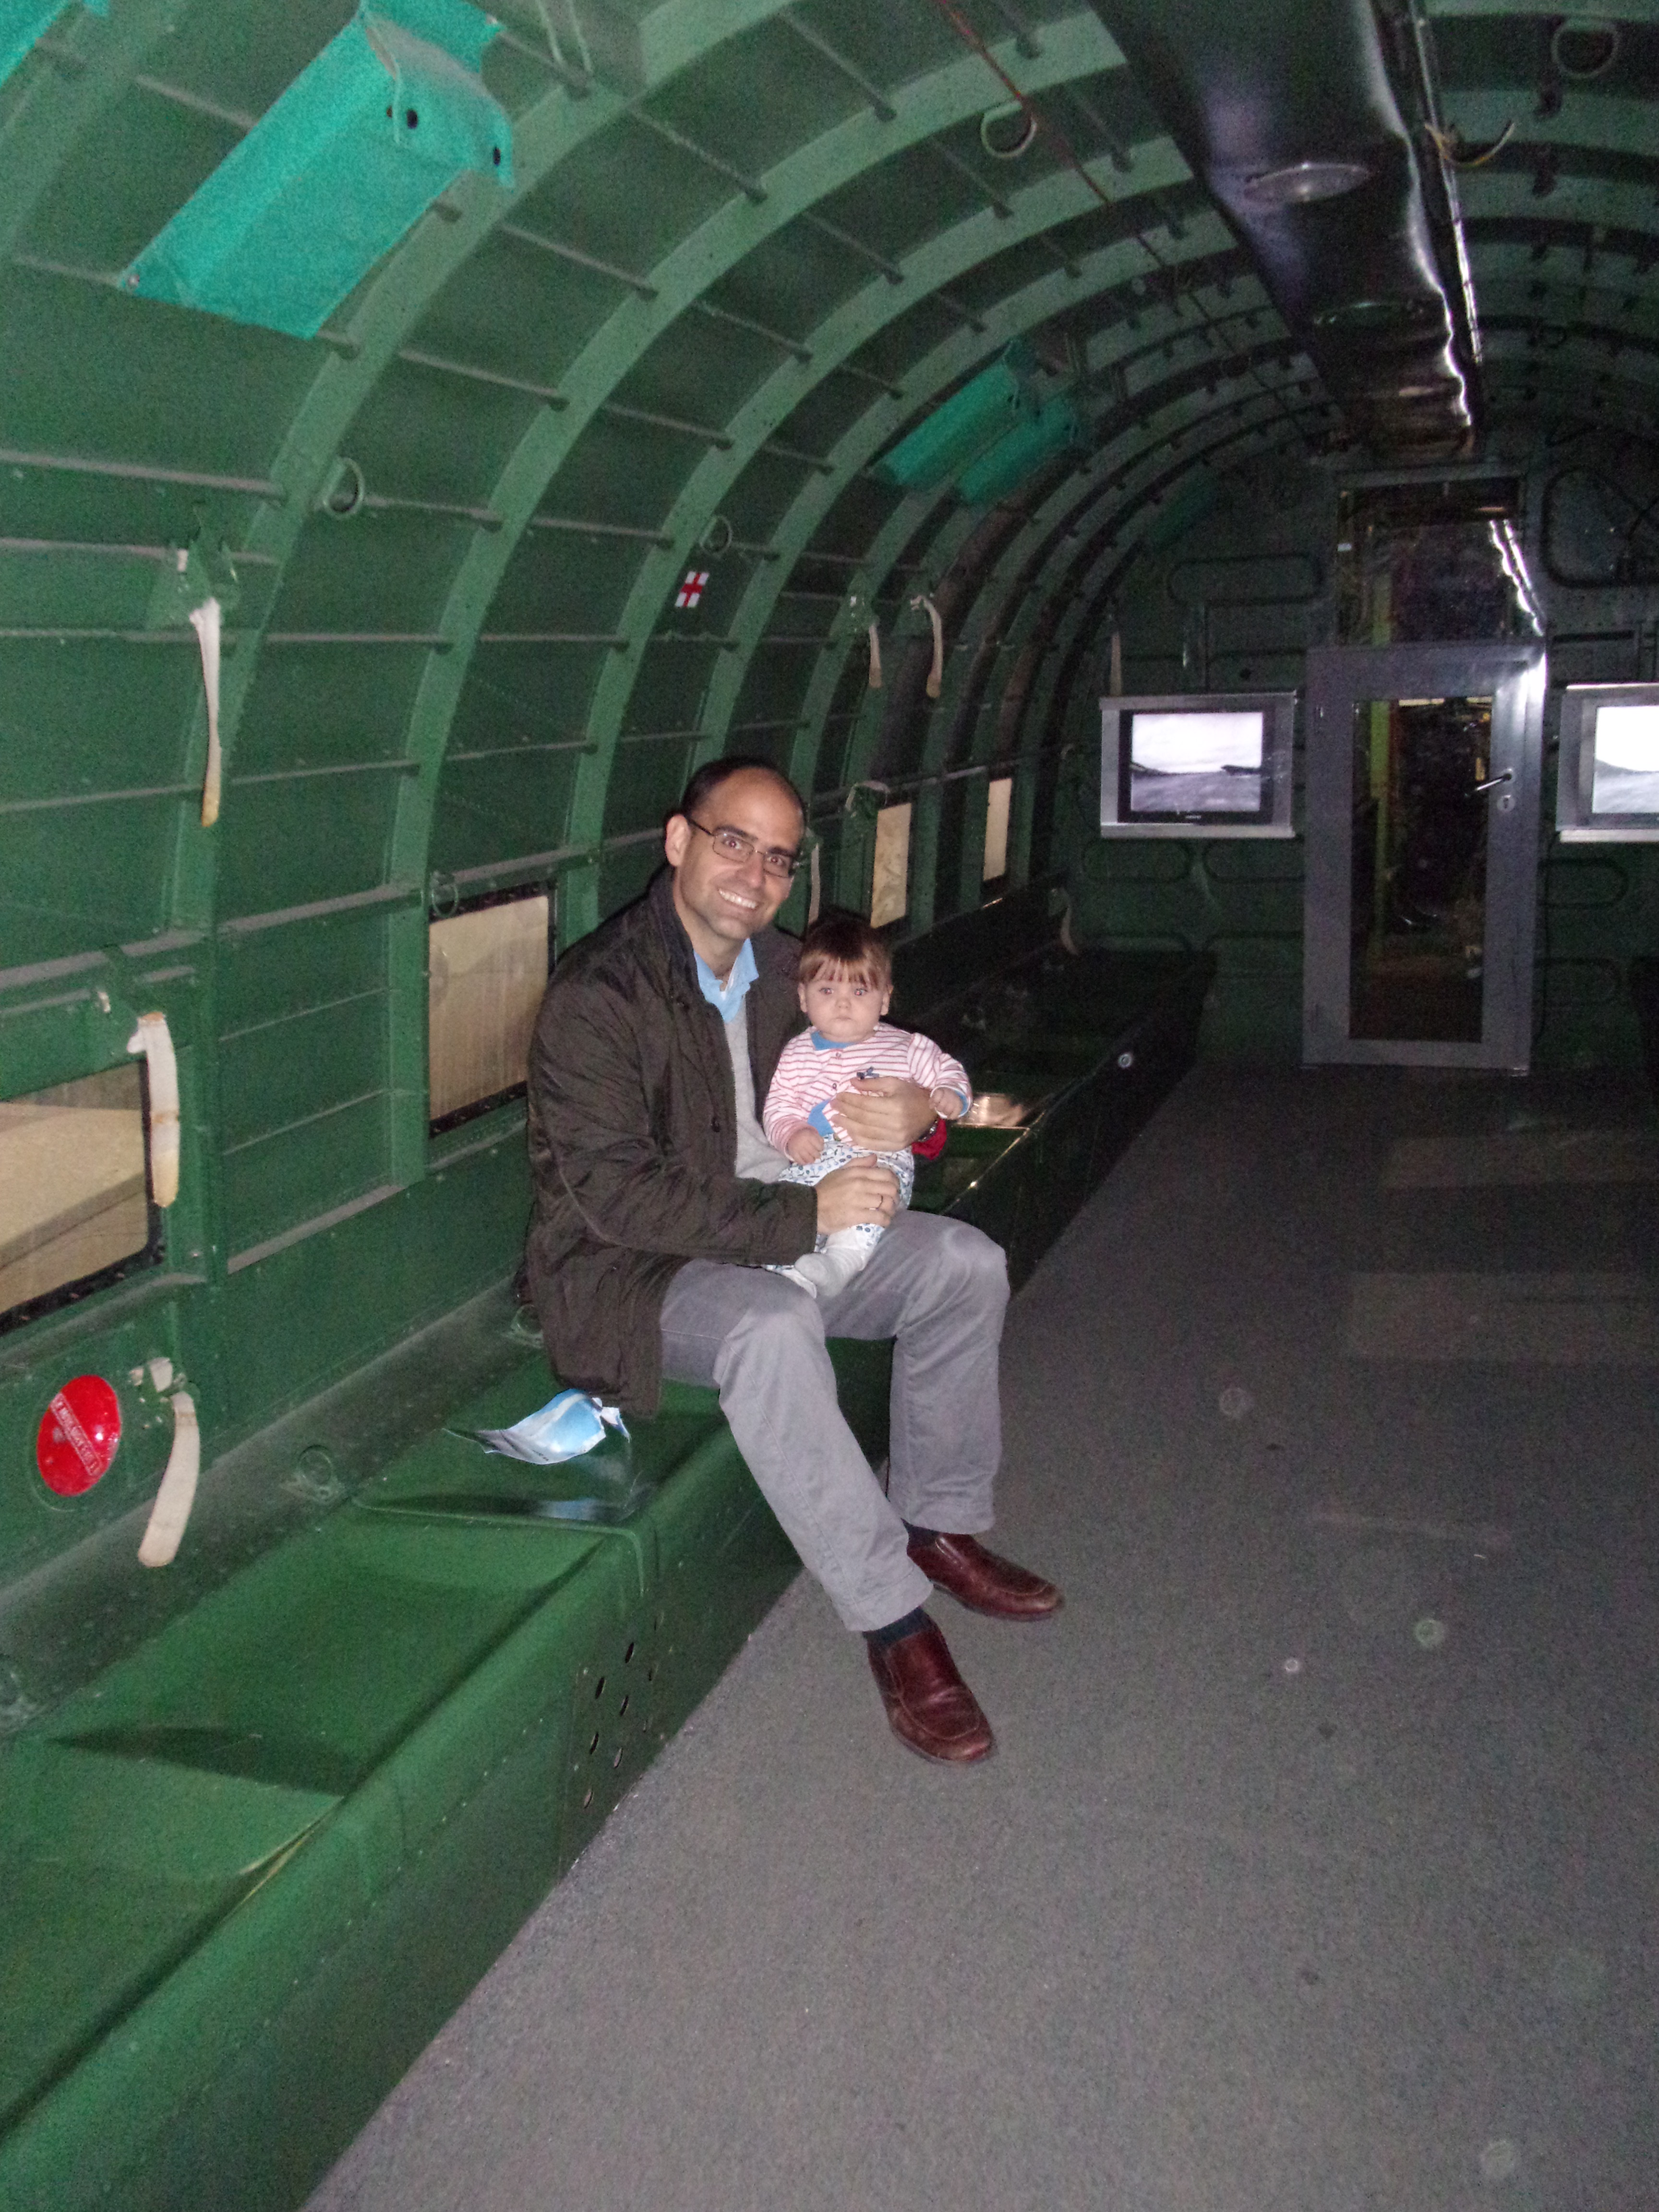
Inside a C-47 Skytrain Dakota.
In this museum you can get on board a C-47 Skytrain (Dakota being the British designation for the airplane). I believe this was the first time I was inside a DC-3 (an aircraft of which importance to aviation cannot be overstated (3)), as if I remember well, in the Aviodrome you could get inside a DC-2 not -3.
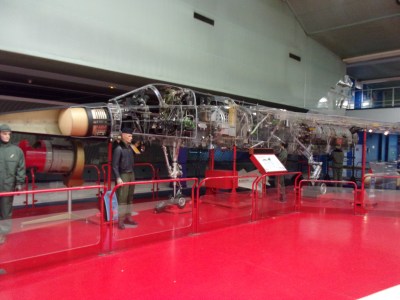
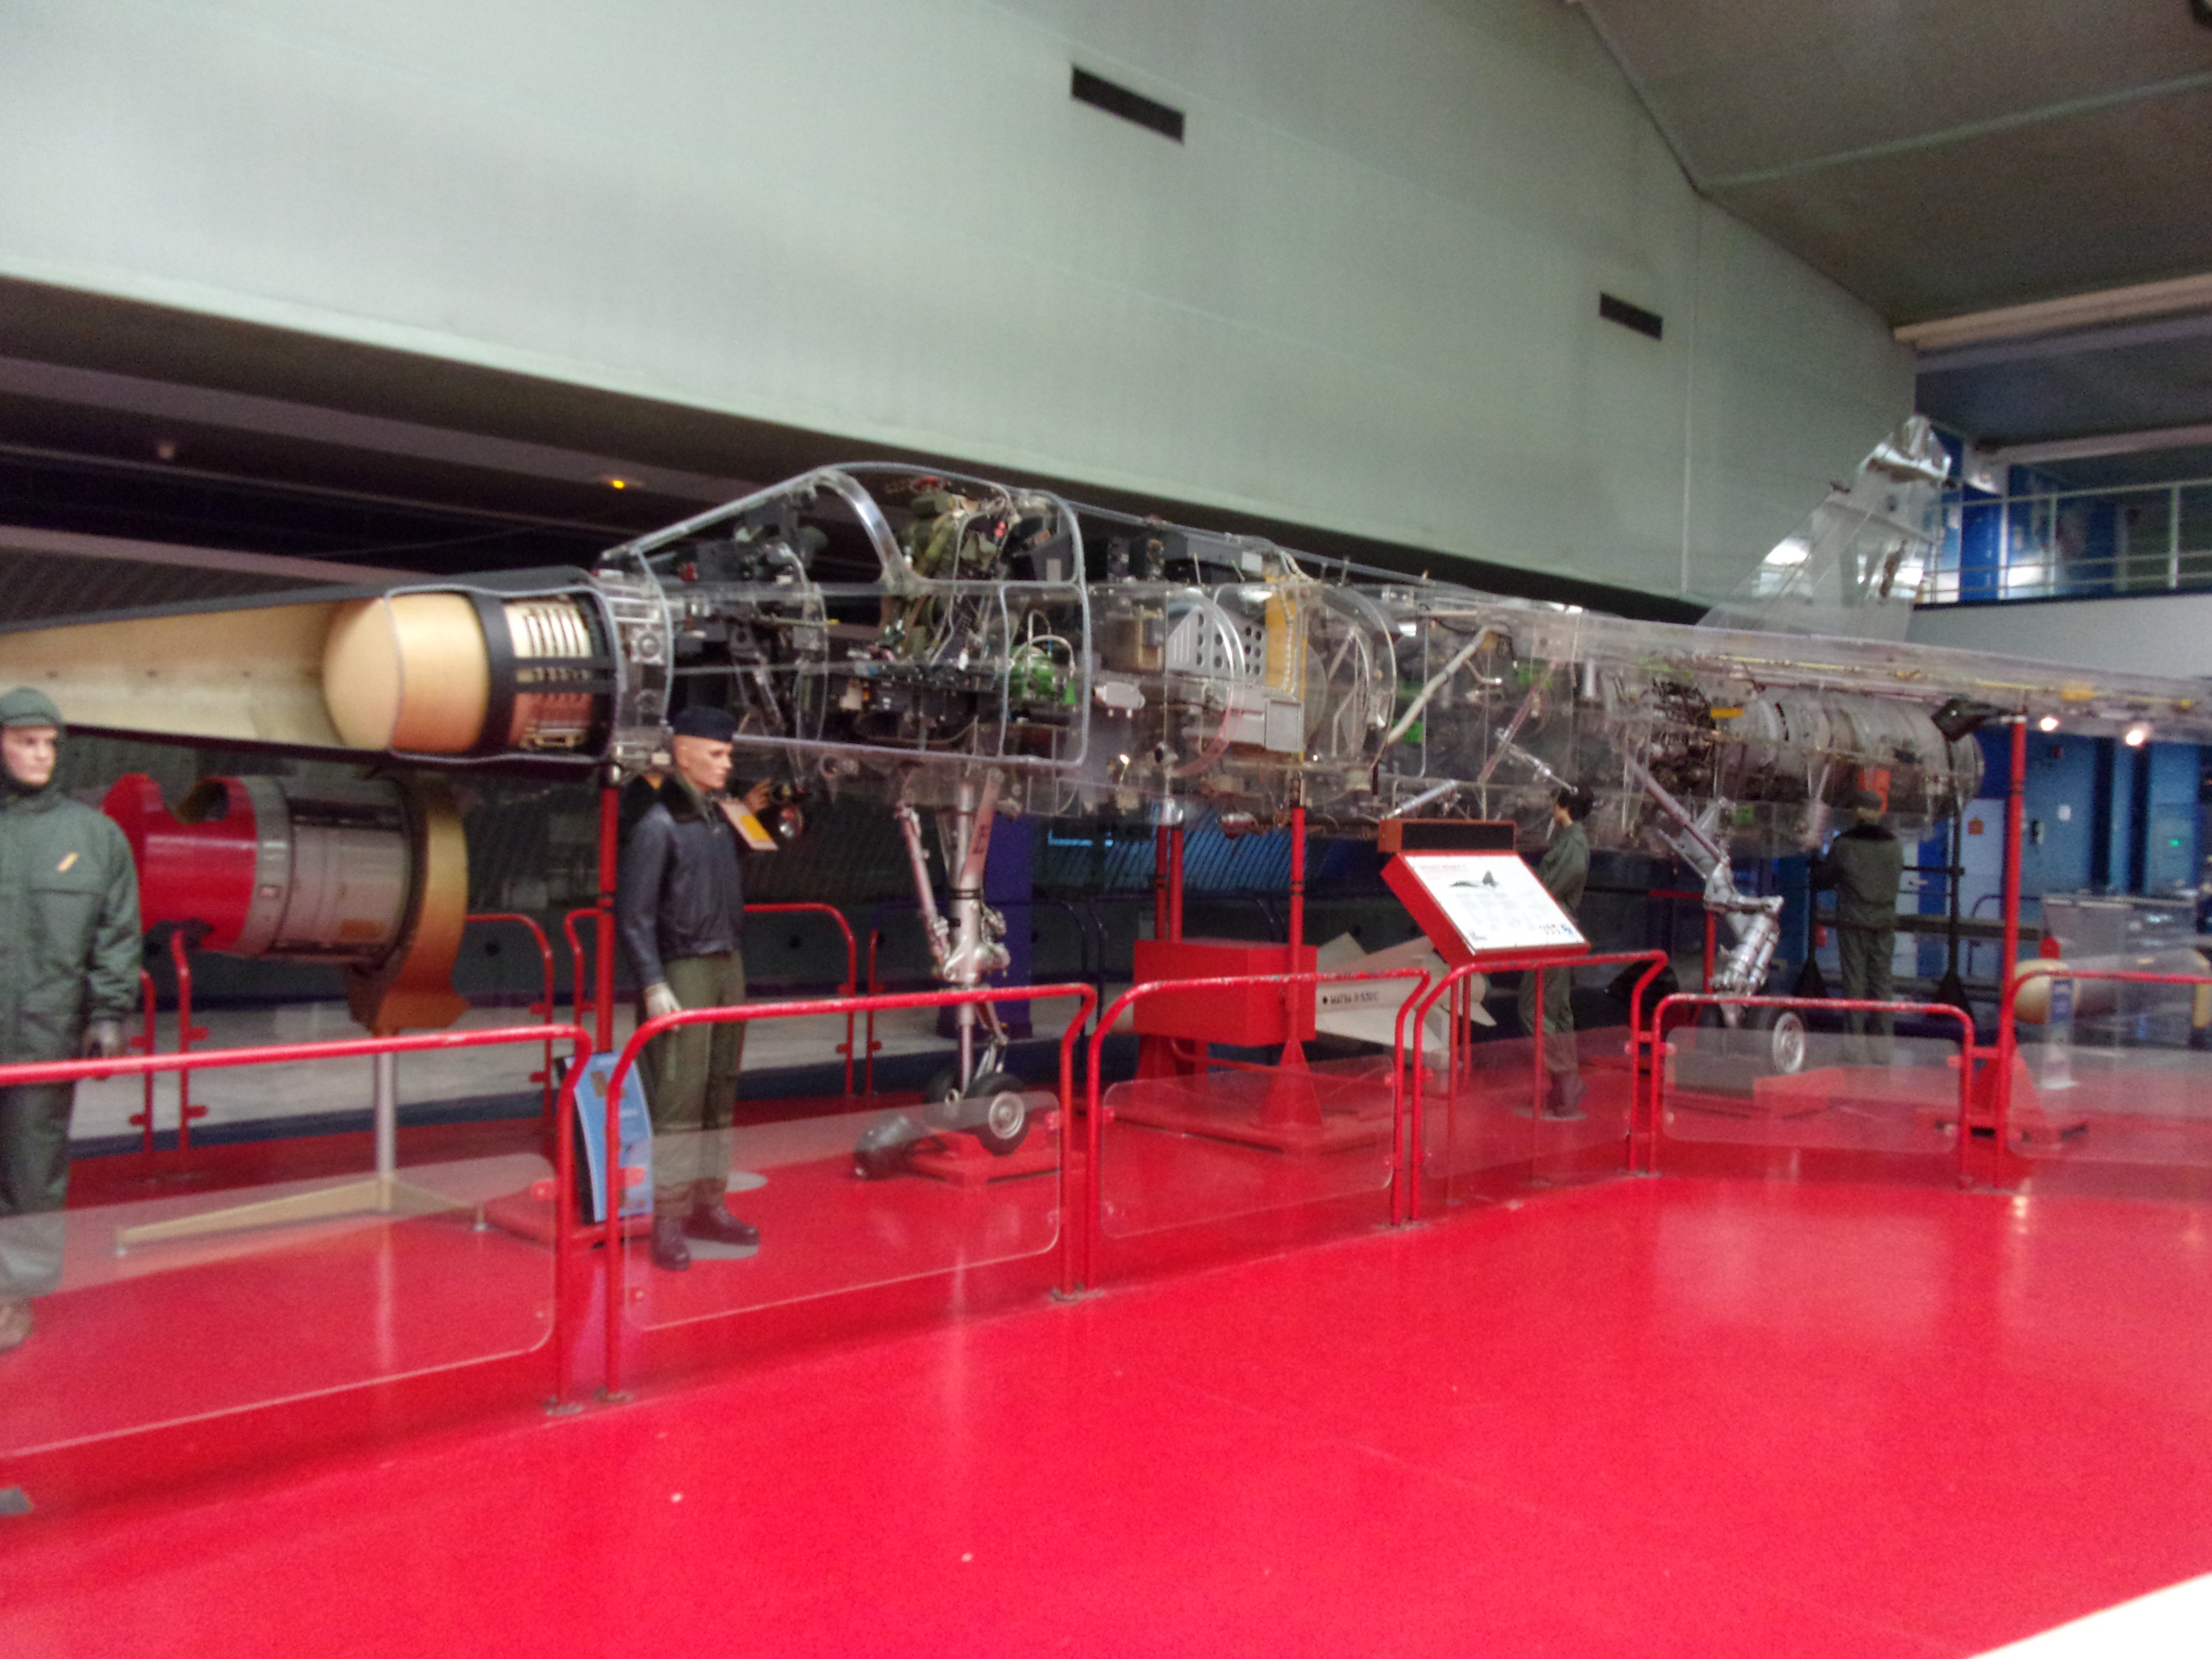
Cut out of a Dassault Mirage F1.
In other museums I had seen cut outs of engines, here in Le Bourget you may see a full size cut out of a Dassault Mirage F1, a wonderful entertainment for engineers and aviation enthusiasts.

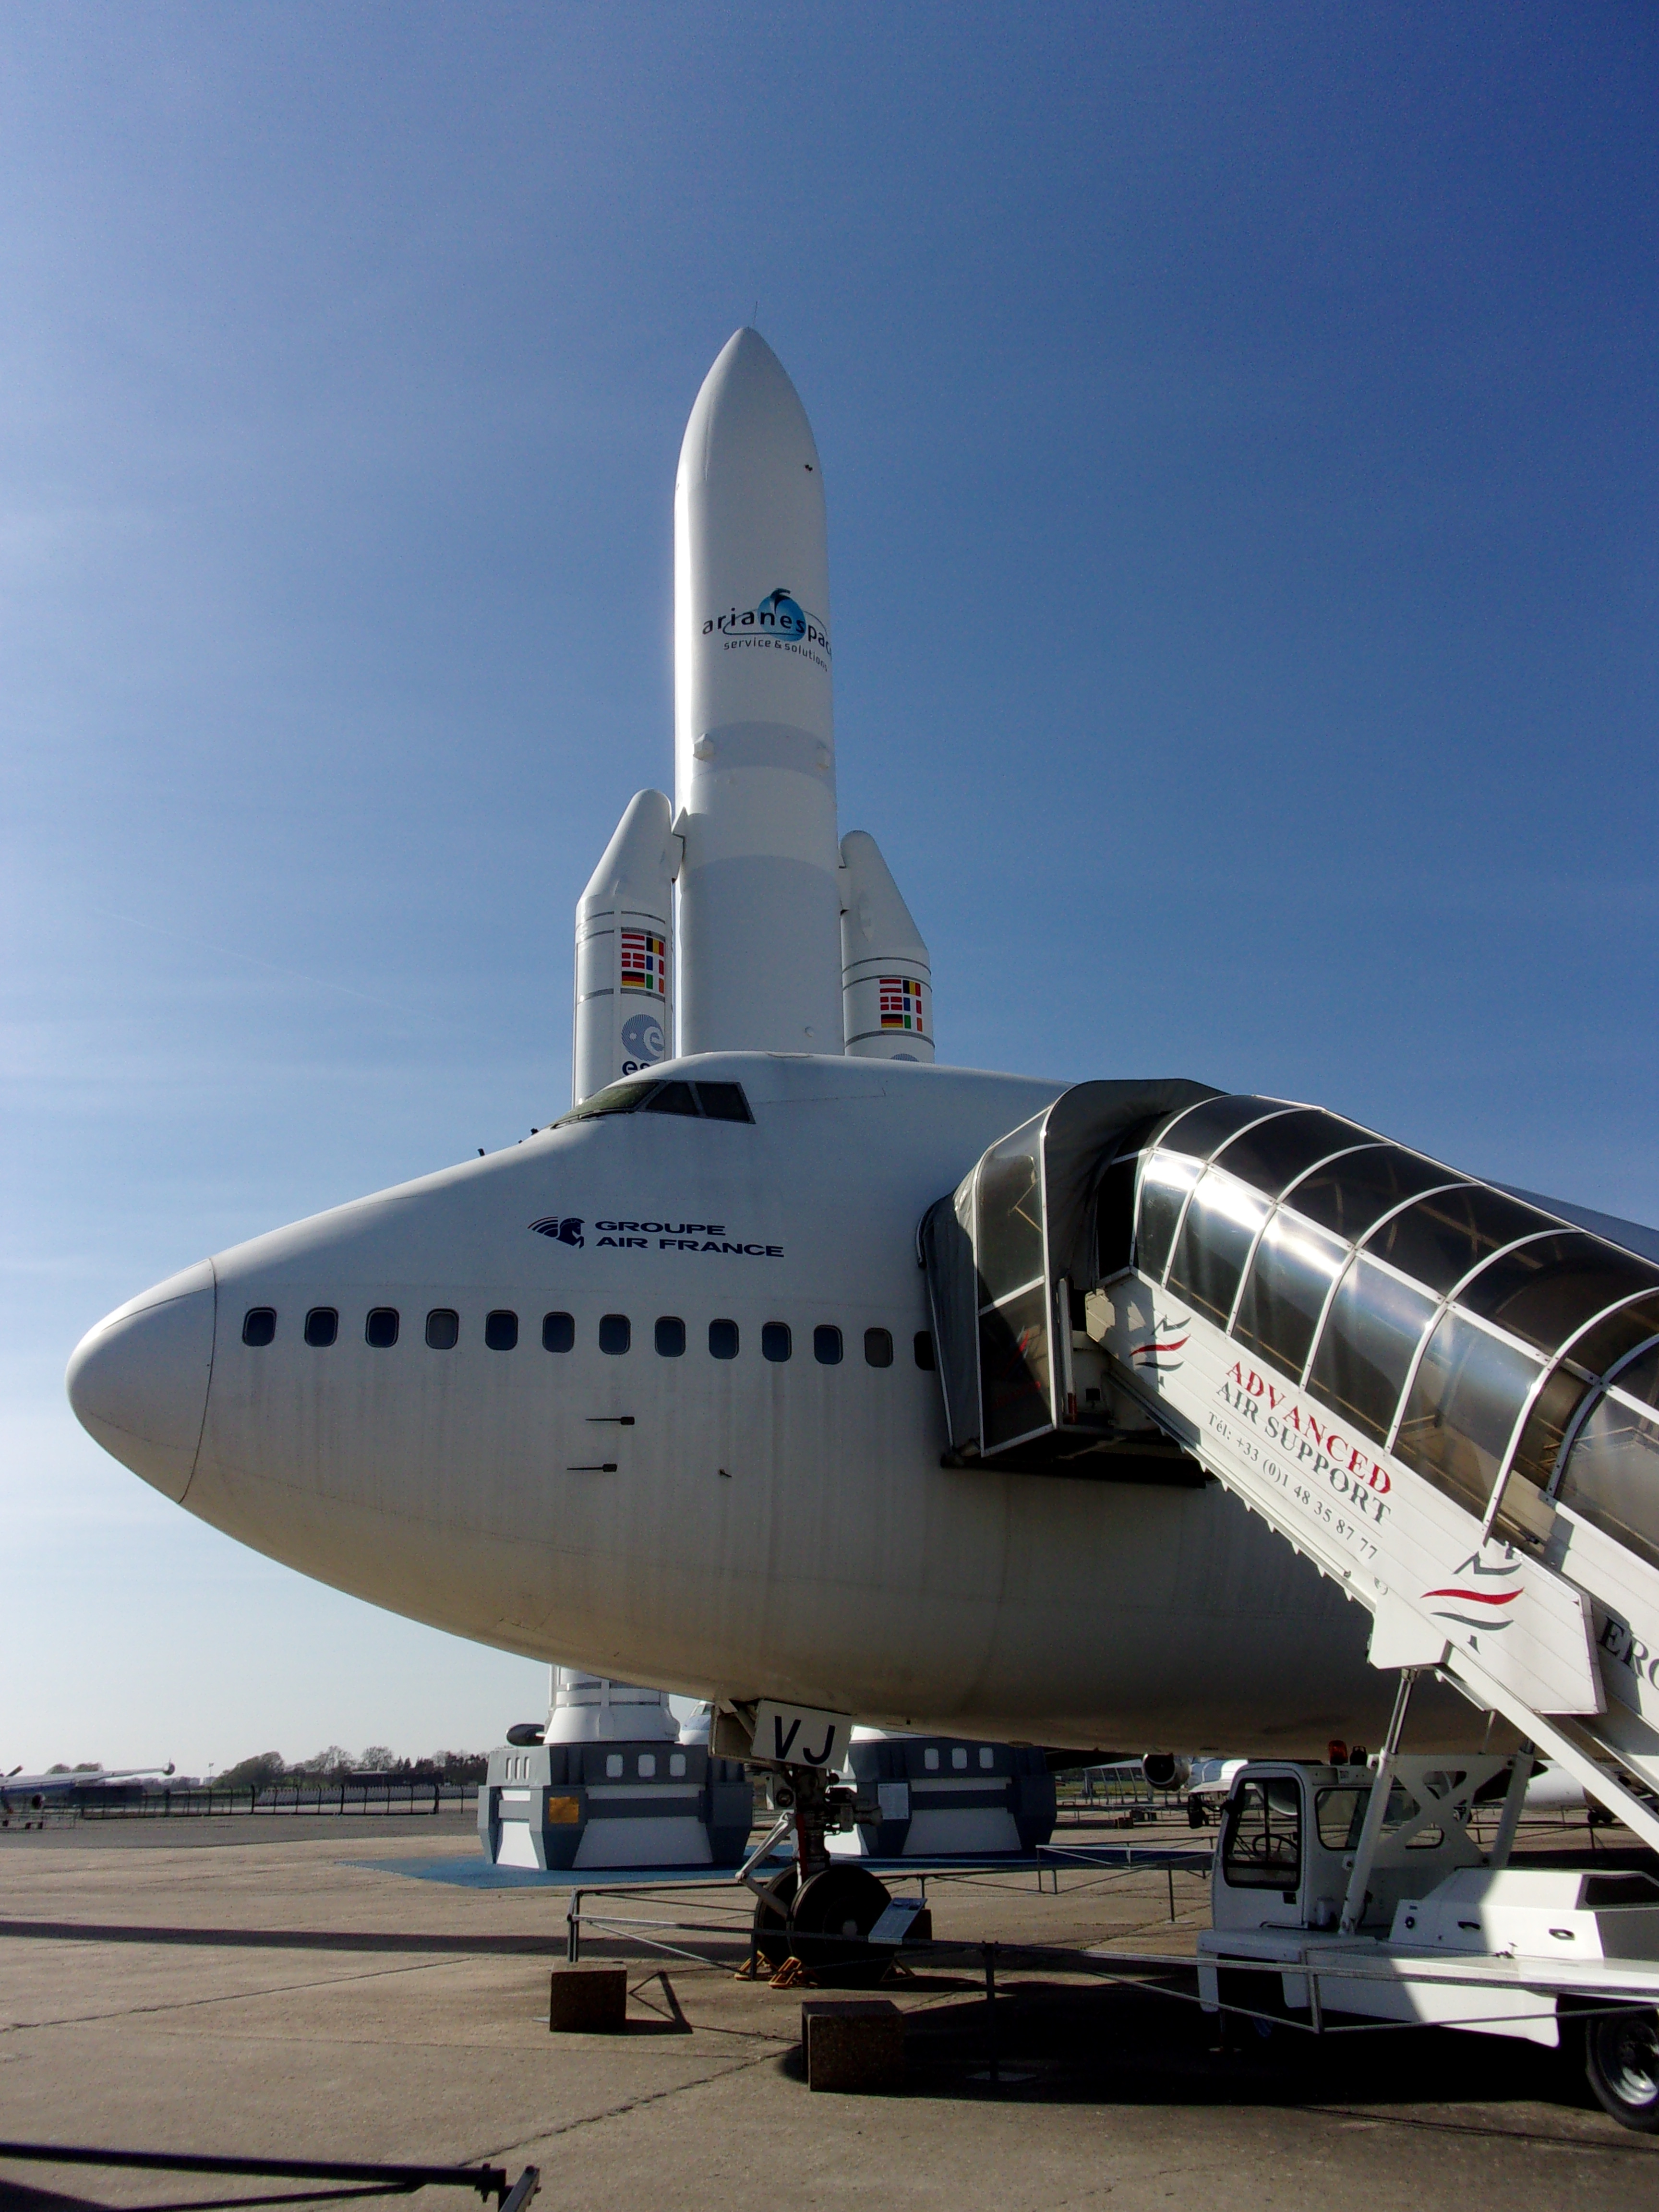
747 and Ariane 5.
In Le Bourget you can see replicas of the Ariane 4 and Ariane 5 (4). That allows you to get a picture of both in the same frame or to get them with a Boeing 747, as pictured above.
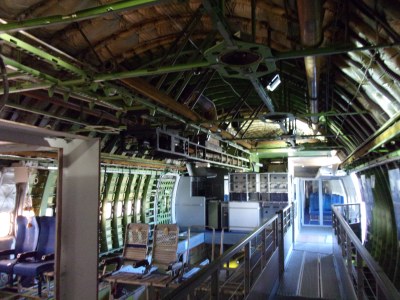
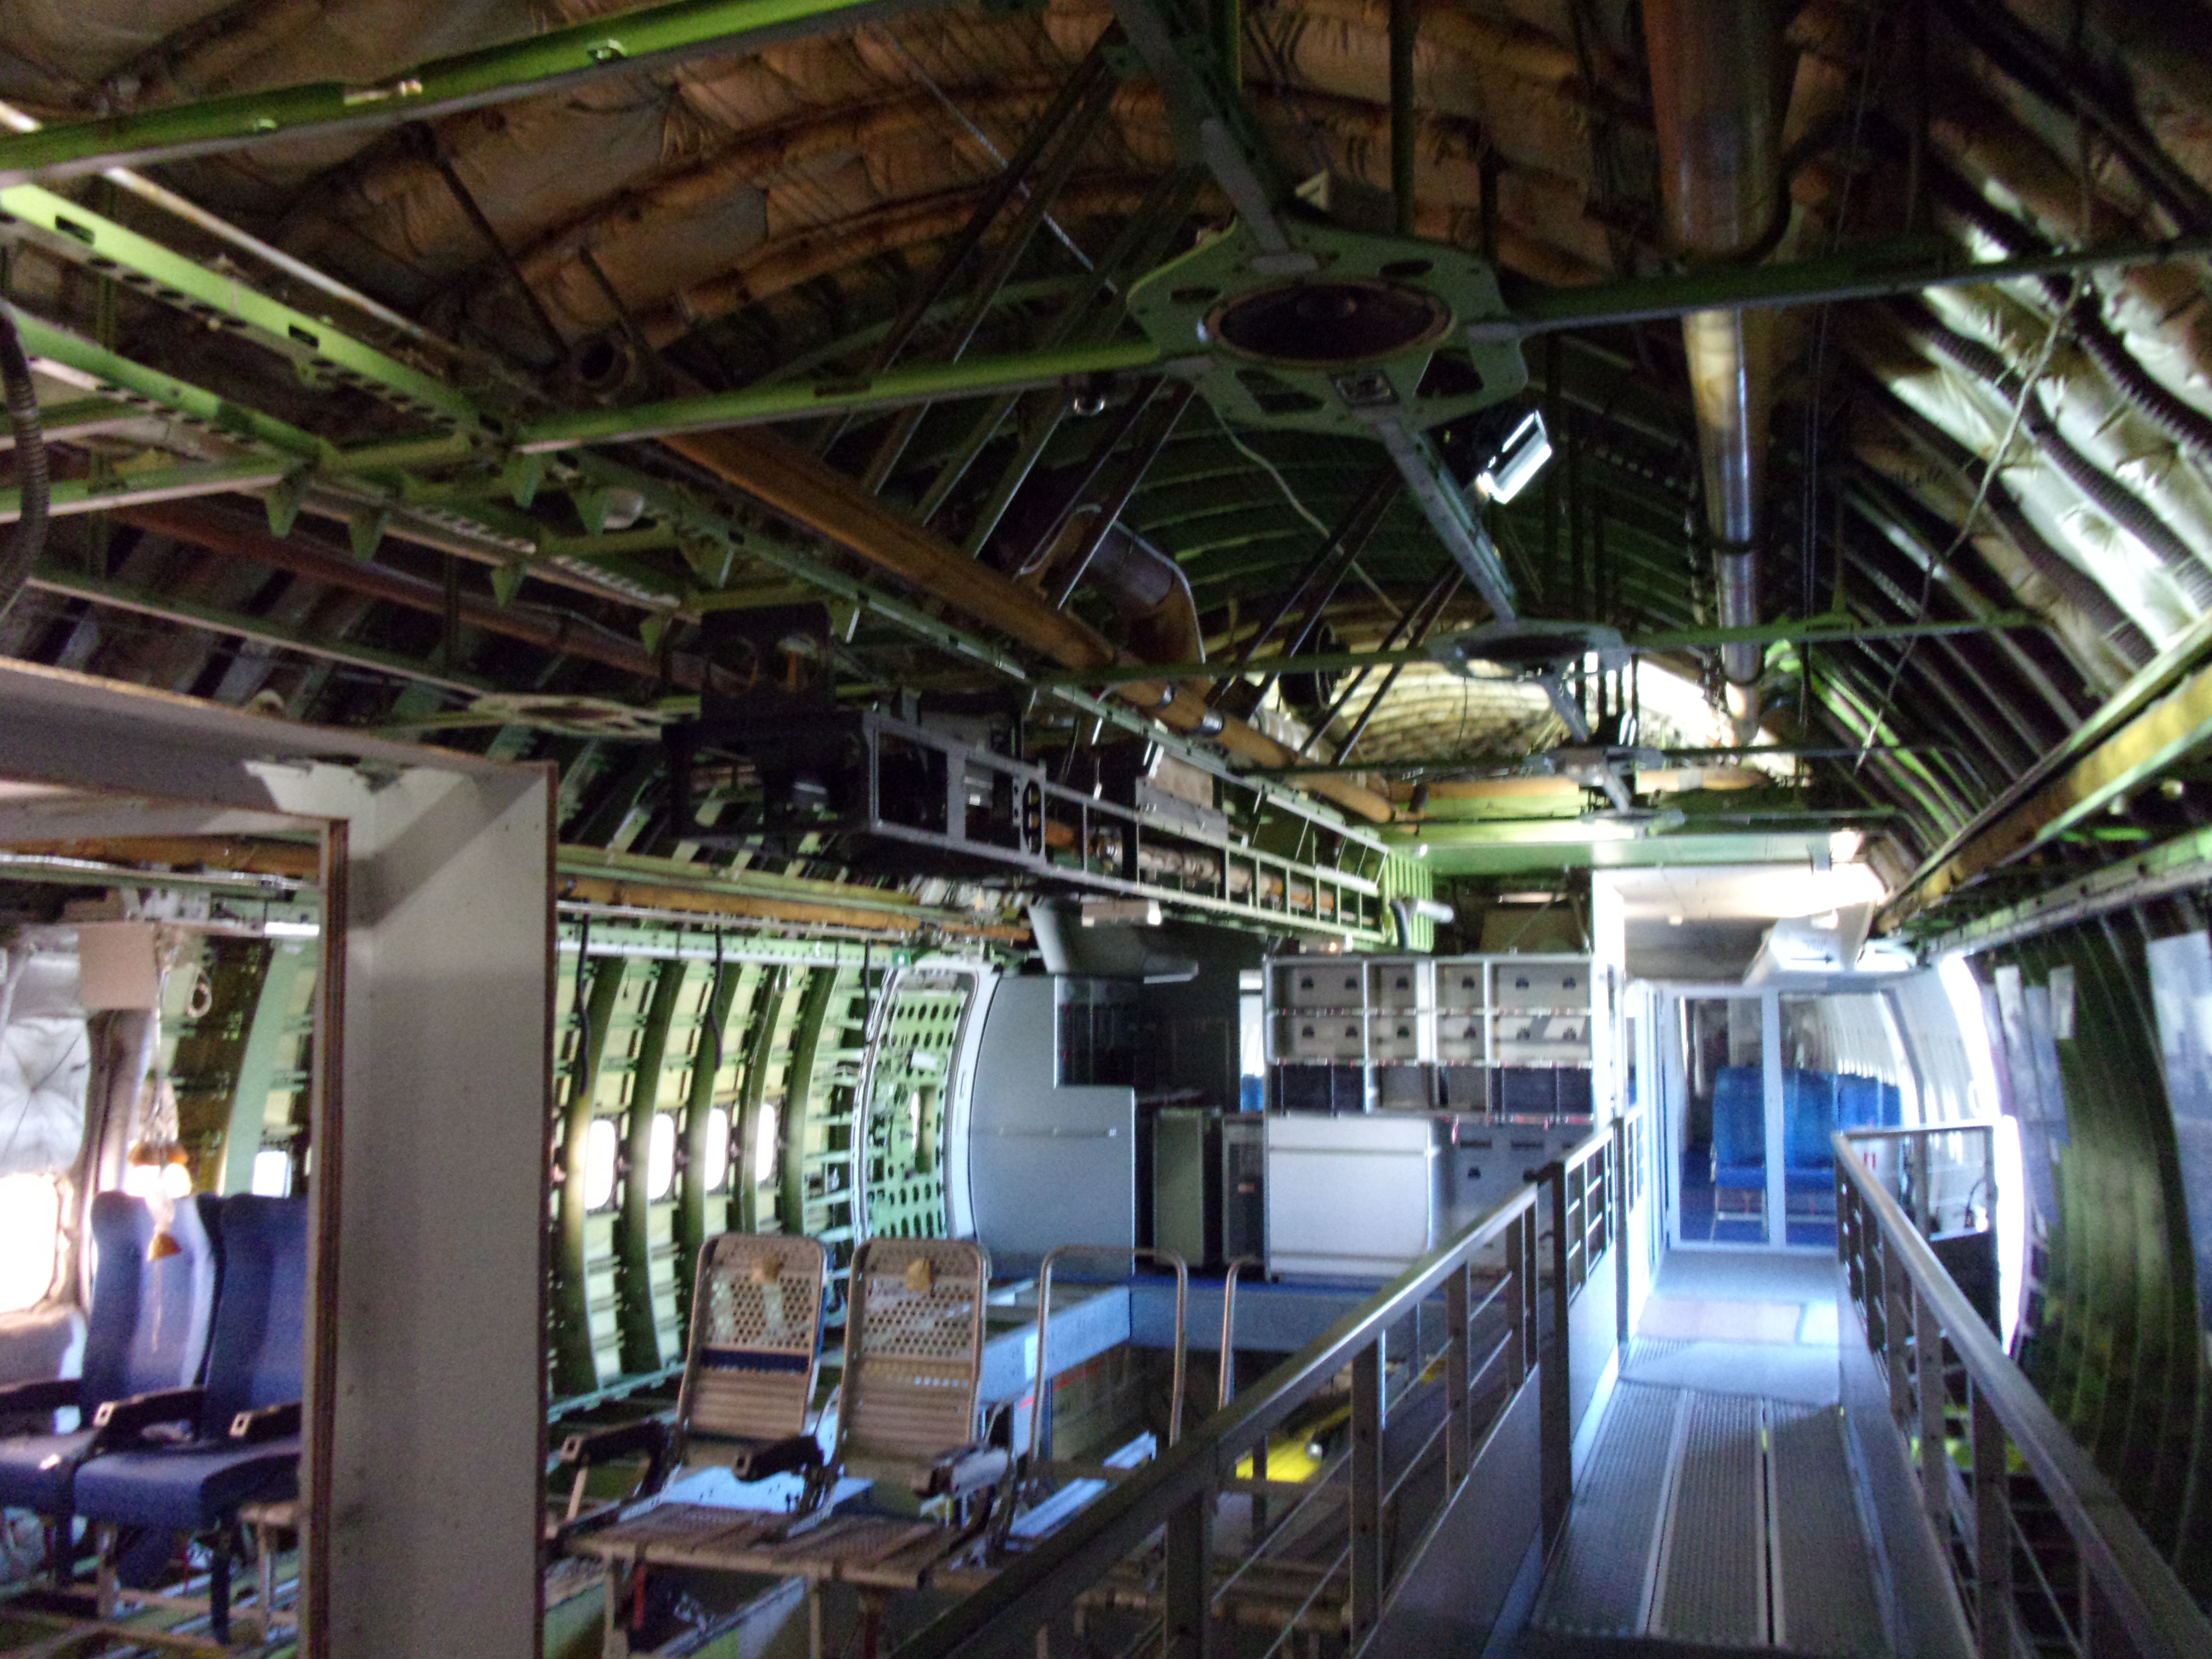
Inside of a Boeing 747 cut out.
The Boeing 747 is legendary aircraft in itself (5) and the chances of flying in it are decreasing by the year as more airplanes are being retired from service. In Le Bourget, you get the chance to see it really from the inside, as parts of it are really cut out so you can admire its structure, systems, etc.
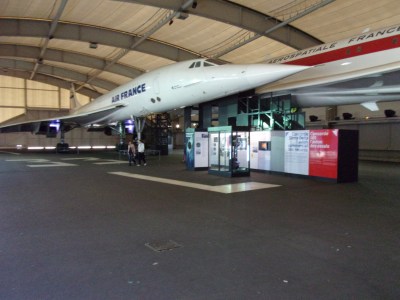
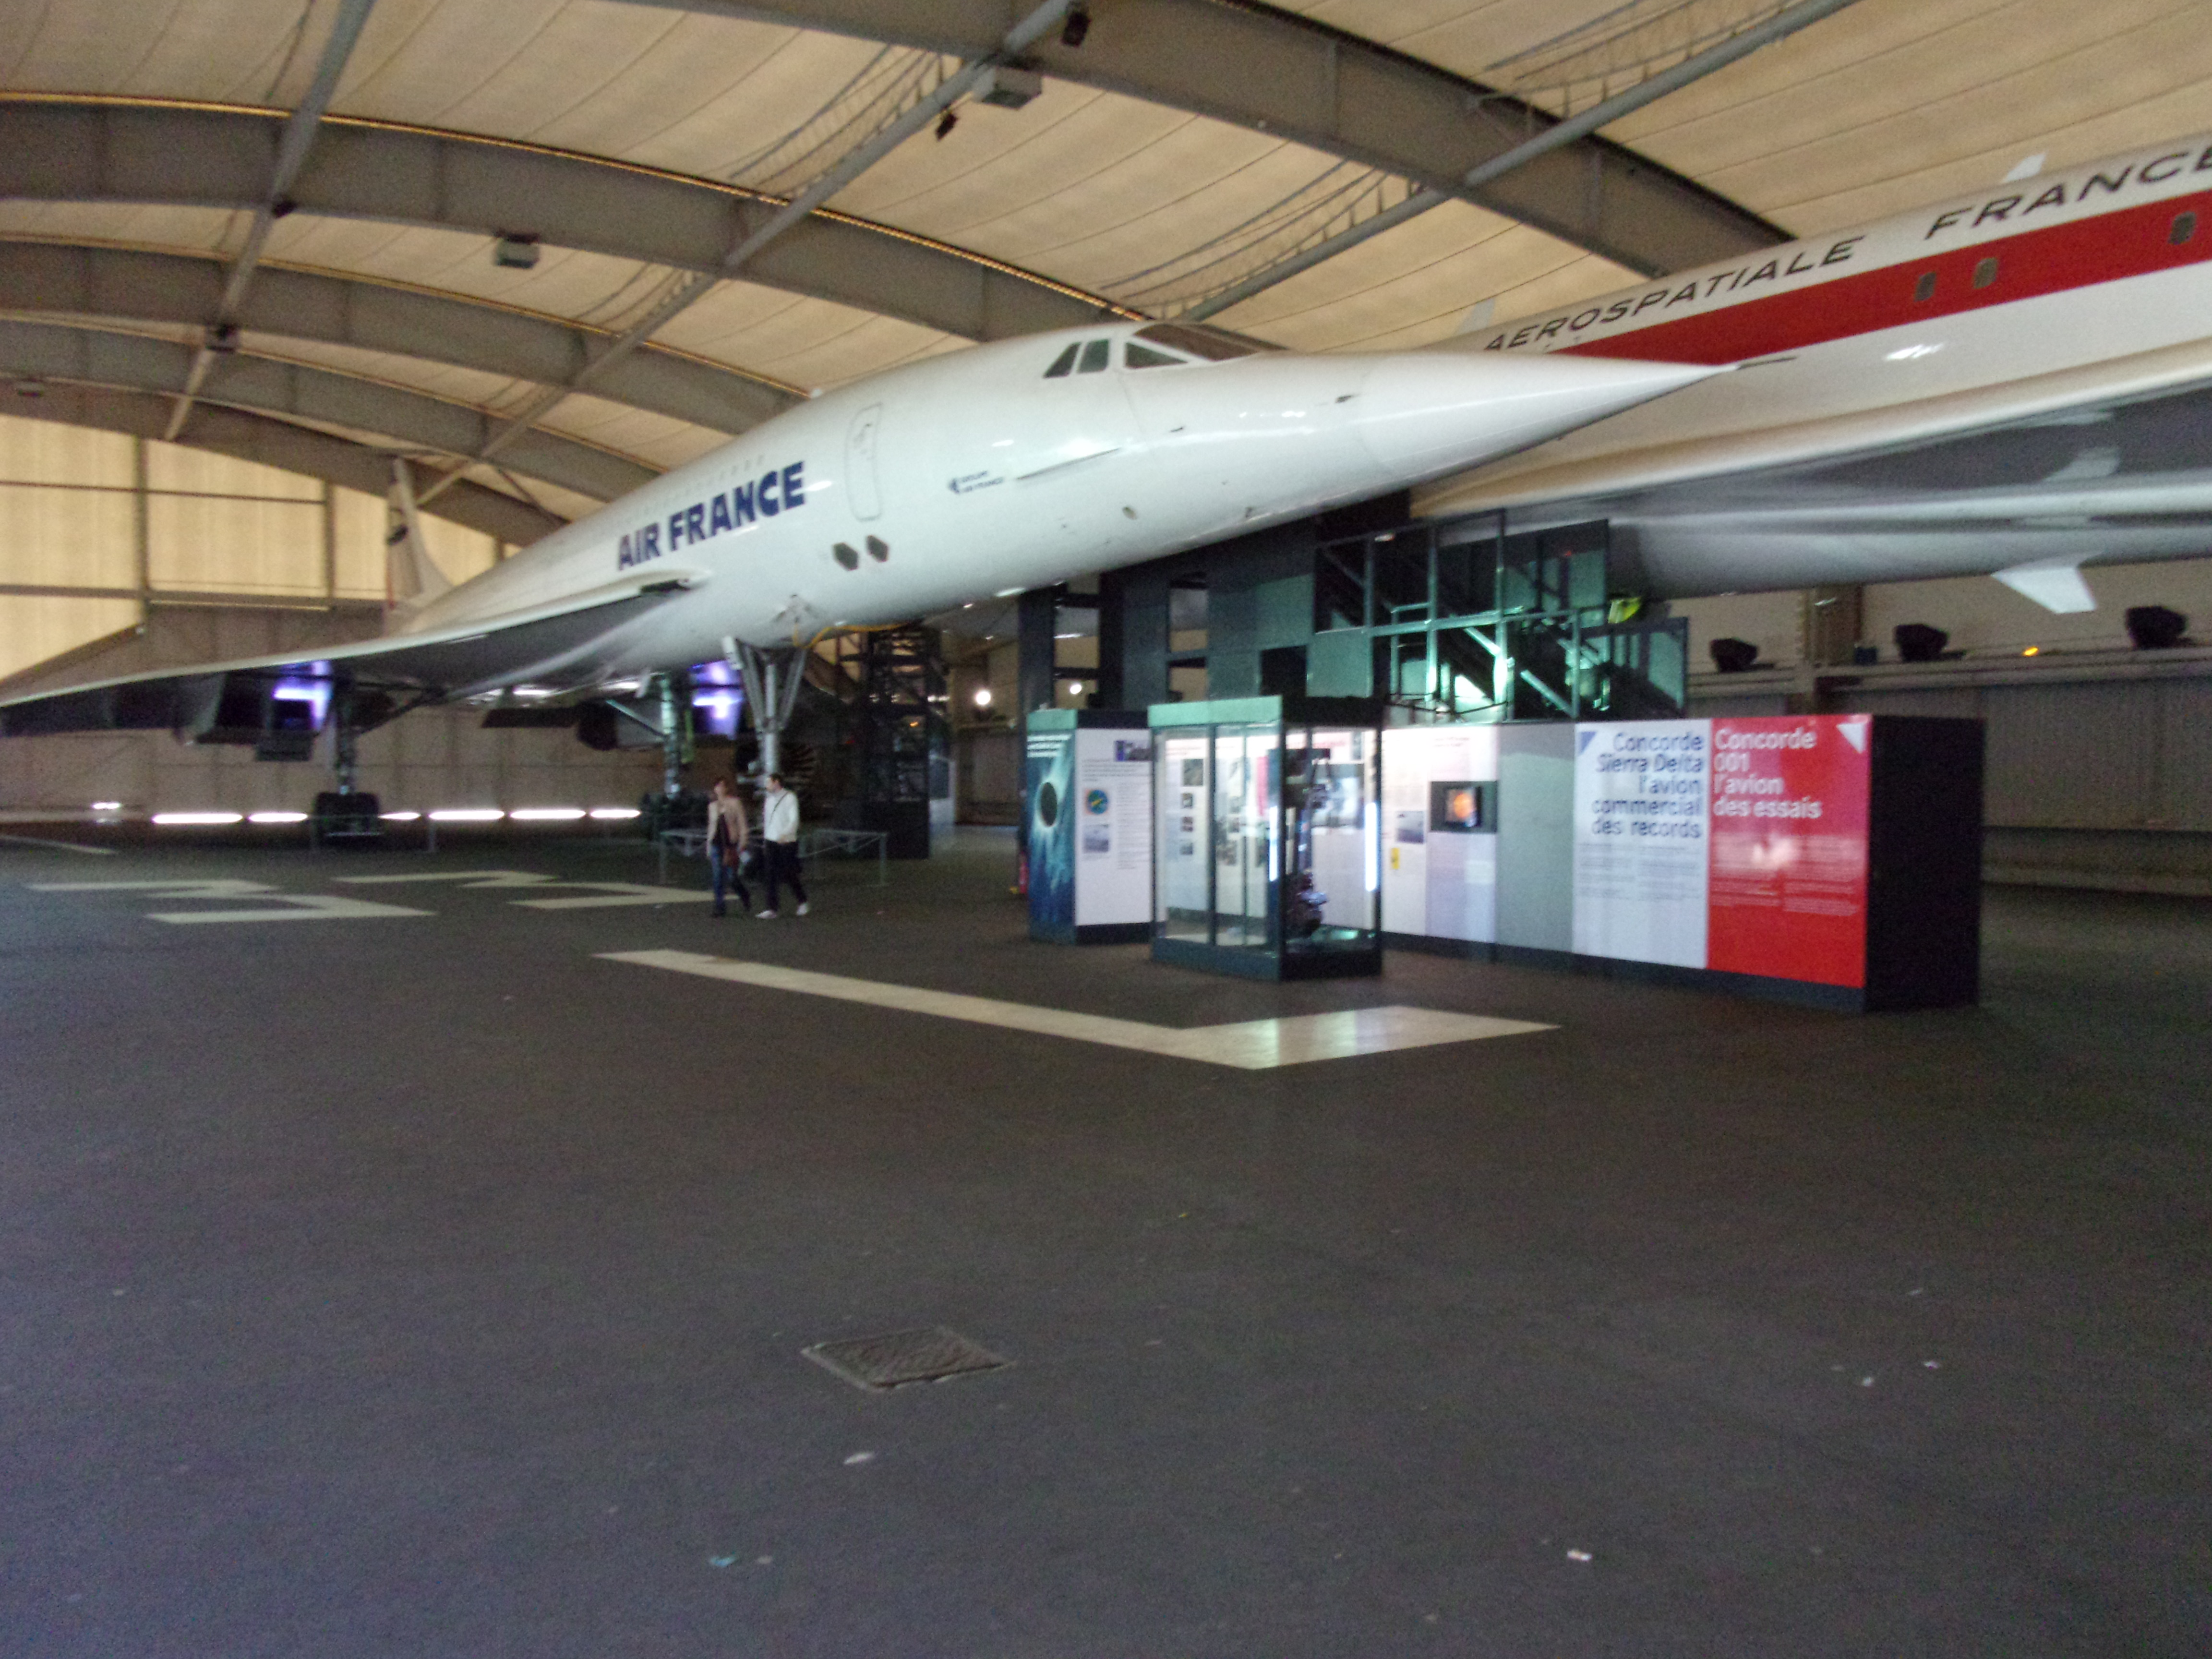
Concorde: prototype 001 and series airliner.
Some museums around the world have the Concorde as a highlight. In some of them you may get into it. Here in Le Bourget you may get into 2, one of them being the prototype 001, where you can see some flight test installations used for different experiments made with it.
I definitely recommend to visit this museum if you happen to be in Paris. It is located at Le Bourget airport and the entrance is free of charge. A ticket to get into some of the aircraft (747, Concorde, C-47) is sold for 8 euros. I would suggest to take no less than 4 hours to visit the museum.
—
(1) In the Aviodrome the local focus is put into the figure of Anthony Fokker.
(2) See in this post a review of French aviation pioneers.
(3) See more of the DC-3 in this post that a wrote as a tribute to Douglas Aircraft Company.
(4) So far, I had only seen a replica of the Ariane 5 at the Cité de l’Espace in Toulouse, see here a post I wrote about it.
(5) See here a book review I wrote about “747” by Joe Sutter, the programme chief engineer.