After the recent announcement by Airbus and Emirates of the signature of an MoU for up to 36 A380 (press release), my friend and colleague Jose and I quickly wondered how would that leave a series of comparisons in which we set out years ago to compare how quickly or not sales of the 747 piled up back in its heyday.
See below the update of those couple of graphics.
First see in the graphic below A380 orders since the programme launch (2001) in comparison to those of the 747 (1966):
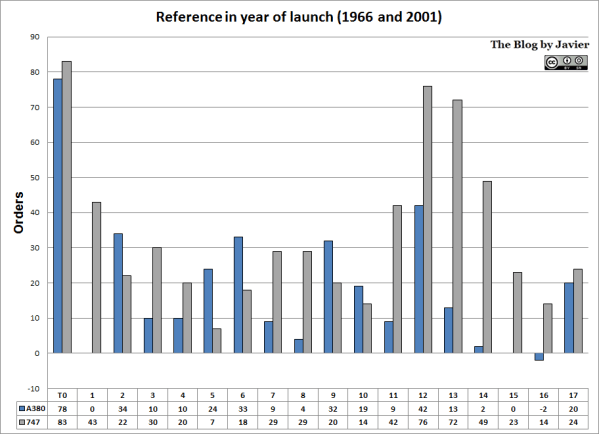
A380 and 747 orders referenced to the year of launch of each programme (up to 2017).
Both programmes show an initial sales rush at the time of programme launch. In both cases the rhythm of sales slowed down after the second year. In the first 18 years of program, each had managed:
- 747: 615 orders.
- A380: 337 orders (55% of 747’s). With a caveat being that we are now in January 2018 and through the end of the year the A380 could pile up some more orders.
Thus, we can see that the Boeing 747 was selling better already from the beginning of the programme.
I include again yet another comparison: aircraft orders taking as reference the year of first delivery, having heard so often the industry mantra that some potential customers would wait to see the aircraft in operation before placing orders. See below this second comparison:
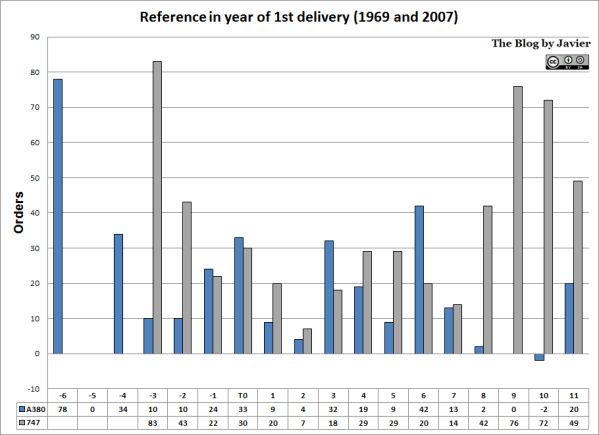
A380 and 747 orders referenced to the year the 1st aircraft delivery of each programme (up to 2017).
In this case, and due to the shorter time to develop the Boeing 747 since program launch (1966), the difference in sales is slightly narrowed:
- 747: 554 orders.
- A380: 337 orders.
You can see that, 11 years after the 1st delivery of each aircraft (2007 for the A380 and 1969 for the 747) the 747 had sold about 50% more aircraft and that is due to the pick up of sales it went through from its 8th year of operation.
Finally, I include below an update of yet another graphic in which we compared the Boeing 747 and Airbus A380 production rates throughout history. The bars show Boeing 747 yearly deliveries. The lines the monthly production rate for both aircraft and its 3-year rolling average. I took this average to smooth the curve even if it is very similar to the year-by-year data.
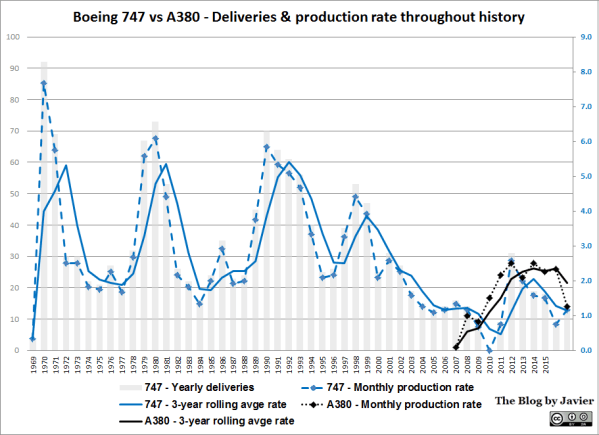
Some comments on the 747 production rates (taken from its yearly deliveries):
- The average monthly production rate since its first delivery back in 1969 has been: 2.6 airplanes per month (1.7 for A380).
- During the first about 30-35 years (till ~2002-3) the rate fluctuated between 2 and 5 deliveries per month.
- Since 2003 the rate has averaged 1.2.
- For the first 11 years of the 747 programme (as the A380 just completed those first eleven years of deliveries), its production rate averaged 3.1 aircraft per month.
Time will tell if the market for the A380 picks up.