Common Security and Defence Policy (CSDP)

Security and Defence is a topic which only makes it to the front pages of the media when there are actual war operations. Rarely a debate is centered on whether the country needs to foster its capabilities, invest in new defence technologies, or protect a certain industry base. I cannot recall a single electoral programme calling for such initiatives. The defence is not popular in today’s (European) society.

“The supreme art of war is to subdue the enemy without fighting.” Sun Tzu

Despite of that, and even if some Europeans take them today for granted, defence and security are no less crucial than many other public services which we expect States to provide us. As Javier Solana (former EU High Representative for Foreign and Security Policy, Secretary-General of NATO and Foreign Minister of Spain) put it few days ago in an article titled “Globalizing European Security“:

Global security – a safe and peaceful environment free of conflict – is a public good. In other words, all of the world’s citizens and countries benefit from it, regardless of whether they contribute to supplying it. Given this, free riders (those who enjoy the benefits of the good without investing in its provision) are likely to be plentiful. But, when it comes to global stability, the world simply cannot afford a free-riding Europe.

This obviously includes Europe: Europe cannot afford a free-riding Europe. As Anders Fogh Rasmussen (current Secretary-General of NATO and former Prime Minister of Denmark) put it yesterday:

I truly believe that we should do much more to educate society in the importance of peace, security and defence as goods to be protected and spread, so they can be better valued and supported.

EUCO Conclusions Defence, December 19, 2013 [PDF, 118KB]

EUCO conclusions on Defence, December 19, 2013 [PDF, 118KB]

Having said that, yesterday took place the first session of a 2-day EU Council in which one of the main topics to be dealt with was Security and Defence. Apart from the one cited above, there have been plenty of interesting articles in days prior to the meeting calling for decisions and actions to be taken by the council. To name a few:

In this post I just want to bring the European Council conclusions [PDF, 118KB] as already published and outline some of the passages.

2. The EU and its Member States must exercise greater responsibilities in response to those challenges if they want to contribute to maintaining peace and security through CSDP […]. The European Council calls on the Member States to deepen defence cooperation by improving the capacity to conduct missions and operations and by making full use of synergies in order to improve the development and availability of the required civilian and military capabilities, supported by a more integrated, sustainable, innovative and competitive European Defence Technological and Industrial Base (EDTIB). This will also bring benefits in terms of growth, jobs and innovation to the broader European industrial sector.

4. […] the European Council has identified a number of priority actions built around three axes: increasing the effectiveness, visibility and impact of CSDP; enhancing the development of capabilities and strengthening Europe’s defence industry.

5. […] The European Union and its Member States can bring to the international stage the unique ability to combine, in a consistent manner, policies and tools ranging from diplomacy, security and defence to finance, trade, development and justice. […]

8. […] The European Council emphasises the need to improve the EU rapid response capabilities, including through more flexible and deployable EU Battle groups […]

9. New security challenges continue to emerge. […] the European Council calls for:

  • an EU Cyber Defence Policy Framework in 2014 […]
  • an EU Maritime Security Strategy by June 2014 […]
  • increased synergies between CSDP and Freedom/Security/Justice actors […]
  • progress in developing CSDP support for third states and regions […]
  • further strengthening cooperation to tackle energy security challenges.

10. Cooperation in the area of military capability development is crucial to maintaining key capabilities, remedying shortfalls and avoiding redundancies. Pooling demand, consolidating requirements and realising economies of scale will allow Member States to enhance the efficient use of resources and ensure interoperability, […]

11. The European Council remains committed to delivering key capabilities […]. Bearing in mind that the capacities are owned and operated by the Member States, it welcomes:

  • the development of Remotely Piloted Aircraft Systems (RPAS) in the 2020-2025 timeframe: preparations for a programme of a next-generation European Medium Altitude Long Endurance RPAS; the establishment of an RPAS user community among the participating Member States owning and operating these RPAS; close synergies with the European Commission on regulation (for an initial RPAS integration into the European Aviation System by 2016); appropriate funding from 2014 for R&D activities;
  • the development of Air-to-Air refuelling capacity: progress towards increasing overall capacity and reducing fragmentation, especially as regards the establishment of a Multi-Role Tanker Transport capacity, with synergies in the field of certification, qualification, in-service support and training;
  • Satellite Communication […]
  • Cyber: developing a roadmap and concrete projects […]

13. The European Council welcomes the existing cooperative models, such as the European Air Transport Command (EATC), and encourages Member States to explore ways to replicate the EATC model in other areas.
14. […] It encourages the further development of incentives for and innovative approaches to such cooperation, including by investigating non market-distorting fiscal measures in accordance with existing European law. […]

16. Europe needs a more integrated, sustainable, innovative and competitive defence technological and industrial base (EDTIB) to develop and sustain defence capabilities. This can also enhance its strategic autonomy and its ability to act with partners. The EDTIB should be strengthened to ensure operational effectiveness and security of supply, while remaining globally competitive and stimulating jobs, innovation and growth across the EU. These efforts should be inclusive with opportunities for defence industry in the EU, […]

17. A well-functioning defence market based on openness, equal treatment and opportunities, and transparency for all European suppliers is crucial. […] with a view to opening up the market for subcontractors from all over Europe, ensuring economies of scale and allowing a better circulation of defence products.

18. To ensure the long-term competitiveness of the European defence industry and secure the modern capabilities needed, it is essential to retain defence Research & Technology (R&T) expertise, especially in critical defence technologies. The European Council invites the Member States to increase investment in cooperative research programmes, […]. Civilian and defence research reinforce each other, including in key enabling technologies and on energy efficiency technology. The European Council therefore welcomes the Commission’s intention to evaluate how the results under Horizon 2020 could also benefit defence and security industrial capabilities. […] to develop proposals to stimulate further dual use research. […]

1 Comment

Filed under Aerospace & Defence

Hudson Miracle Approach

Most of you probably heard about the US Airways flight 1549 which on January 15th, 2009, had to land on the river Hudson (New York, USA) due to the loss of engine thrust right after bird strikes in the climb path.

Despite of the recognized initial denial reported by the Captain in the interview below, crucial decisions were taken within the 1st minute after the event. See the captain’s explanations [10 minutes]:

If you want to “re-live” what happened, see the 3-D animation of the flight with the real recorded voices of the conversation between the airplane and air traffic controllers:

This accident had a happy ending thanks to the several layers of safety that exist today in commercial aviation, just to name a few: contained engine failure, pilot training, clear communication protocols and phraseology, etc.

Today we can remember that episode with the following chart I found in Twitter via a work colleague:

Jeppesen KLGA/LGA chart, or "Hudson Miracle Approach".

Jeppesen KLGA/LGA chart, or “Hudson Miracle Approach”.

Leave a comment

Filed under Aerospace & Defence

On Boards of directors and CEOs

The Economist issue published last week included an article (“From cuckolds to captains”) about the transformation of corporate boards. However, I wanted to extract the following passages:

For most of their history, boards have been largely ceremonial institutions: friends of the boss who meet every few months to rubber-stamp his decisions and have a good lunch. Critics have compared directors to “parsley on fish”, decorative but ineffectual; or honorary colonels, “ornamental in parade but fairly useless in battle”. Ralph Nader called them “cuckolds” who are always the last to know when managers have erred.

[…]

The first is that boards should focus on providing companies with strategic advice. This sort of common sense is often in short supply in the ego-driven world of boards. Boardrooms contain too many people with different priorities: corporate veterans who give lectures on how they would have handled things; egomaniacs who like to show how much they know about everything; hobby-horse jockeys who mount the same steed regardless of the race; captives of compliance who are obsessed with box-ticking. The authors say that in their experience perhaps half of the Fortune 500 companies have one or two directors they would regard as “dysfunctional”.

While reading these passages from the article I couldn’t help but remembering Warren Buffett on board of directors in his 2009 letter to Berkshire Hathaway shareholders [PDF, 116KB] (the emphasis is mine):

“In my view a board of directors of a huge financial institution is derelict if it does not insist that its CEO bear full responsibility for risk control. If he’s incapable of handling that job, he should look for other employment. And if he fails at it – with the government thereupon required to step in with funds or guarantees – the financial consequences for him and his board should be severe.

It has not been shareholders who have botched the operations of some of our country’s largest financial institutions. Yet they have borne the burden, with 90% or more of the value of their holdings wiped out in most cases of failure. Collectively, they have lost more than $500 billion in just the four largest financial fiascos of the last two years. To say these owners have been “bailed-out” is to make a mockery of the term.

The CEOs and directors of the failed companies, however, have largely gone unscathed. Their fortunes may have been diminished by the disasters they oversaw, but they still live in grand style. It is the behavior of these CEOs and directors that needs to be changed: If their institutions and the country are harmed by their recklessness, they should pay a heavy price – one not reimbursable by the companies they’ve damaged nor by insurance. CEOs and, in many cases, directors have long benefitted from oversized financial carrots; some meaningful sticks now need to be part of their employment picture as well.”

[…]

“In evaluating a stock-for-stock offer, shareholders of the target company quite understandably focus on the market price of the acquirer’s shares that are to be given them. But they also expect the transaction to deliver them the intrinsic value of their own shares – the ones they are giving up. If shares of a prospective acquirer are selling below their intrinsic value, it’s impossible for that buyer to make a sensible deal in an all-stock deal. You simply can’t exchange an undervalued stock for a fully-valued one without hurting your shareholders.

Imagine, if you will, Company A and Company B, of equal size and both with businesses intrinsically worth $100 per share. Both of their stocks, however, sell for $80 per share. The CEO of A, long on confidence and short on smarts, offers 1 1⁄4 shares of A for each share of B, correctly telling his directors that B is worth $100 per share. He will neglect to explain, though, that what he is giving will cost his shareholders $125 in intrinsic value. If the directors are mathematically challenged as well, and a deal is therefore completed, the shareholders of B will end up owning 55.6% of A & B’s combined assets and A’s shareholders will own 44.4%. Not everyone at A, it should be noted, is a loser from this nonsensical transaction. Its CEO now runs a company twice as large as his original domain, in a world where size tends to correlate with both prestige and compensation.

If an acquirer’s stock is overvalued, it’s a different story: Using it as a currency works to the acquirer’s advantage. That’s why bubbles in various areas of the stock market have invariably led to serial issuances of stock by sly promoters. Going by the market value of their stock, they can afford to overpay because they are, in effect, using counterfeit money. Periodically, many air-for-assets acquisitions have taken place, the late 1960s having been a particularly obscene period for such chicanery. Indeed, certain large companies were built in this way. (No one involved, of course, ever publicly acknowledges the reality of what is going on, though there is plenty of private snickering.)

[…]

“I have been in dozens of board meetings in which acquisitions have been deliberated, often with the directors being instructed by high-priced investment bankers (are there any other kind?). Invariably, the bankers give the board a detailed assessment of the value of the company being purchased, with emphasis on why it is worth far more than its market price. In more than fifty years of board memberships, however, never have I heard the investment bankers (or management!) discuss the true value of what is being given. When a deal involved the issuance of the acquirer’s stock, they simply used market value to measure the cost. They did this even though they would have argued that the acquirer’s stock price was woefully inadequate – absolutely no indicator of its real value – had a takeover bid for the acquirer instead been the subject up for discussion.

When stock is the currency being contemplated in an acquisition and when directors are hearing from an advisor, it appears to me that there is only one way to get a rational and balanced discussion. Directors should hire a second advisor to make the case against the proposed acquisition, with its fee contingent on the deal not going through. Absent this drastic remedy, our recommendation in respect to the use of advisors remains: “Don’t ask the barber whether you need a haircut.”

After these paragraphs harsh on CEOs and directors, let me finish with two references to posts I wrote some time ago: “Is talent really worth it?“, a review of a book on CEOs pay, and “Buffett on shares buy back by companies“, excerpt from 1980 letter.

Leave a comment

Filed under Investing

The Titanic: a project management disaster

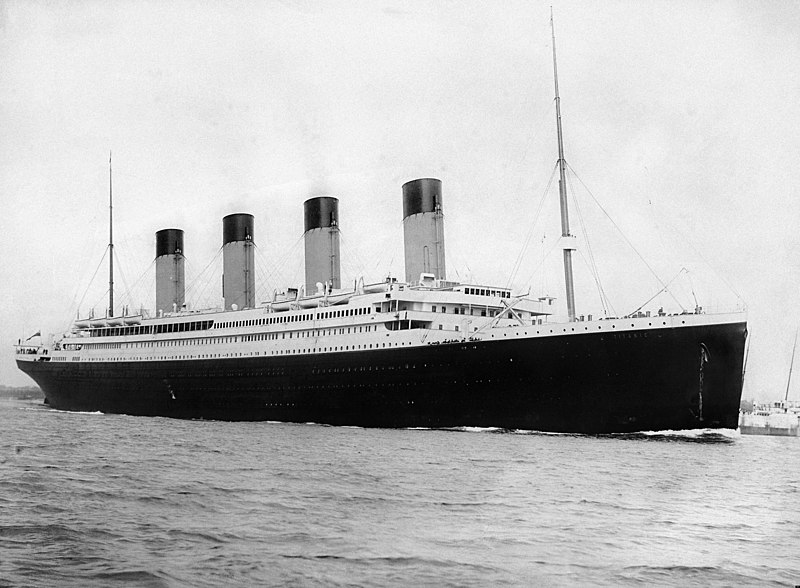
The Titanic (public domain image, taken from Wikimedia, by F. Stuart).

Few days ago, I attended a conference on an example of a project management disaster: the Titanic, the British ship which sank in its maiden trip from Southampton to New York in 1912 causing the death of above 1,500 passengers, above 2 thirds of those aboard.

[The conference was part of the same cycle of which I attended another one about 2 months ago about the success of the management project for the delivery of the infrastructure, design and construction of buildings, transport and the legacy of the London 2012 Olympic Games (I wrote about it here).]

Learning from a well-known disaster, as opposed to a success, made the audience more eager to listen to Ranjit Sidhu, a consultant who has made extensive research about the Titanic and has written the book “Titanic Lessons in Project Leadership“.

She was going to focus the conference on 3 sides of project management: communication, leadership and teamwork (1), and the problems which each of those originated in the disaster.

Titanic captain E. J. Smith (public domain image, taken from Wikimedia, author: New York Times).

Sidhu started giving an introduction of some of the characters involved in the project to show the kind of power plays and conflicts that took place at the time of taking decisions. Some of those characters were: Bruce Ismay (chairman of White Star Line), Lord Pirrie (chairman of the shipbuilding company Harland and Wolff), J.P. Morgan (American banker who financed the formation of International Mercantile Marine Company, mother company of White Star Line), Alexander Carlisle (chief engineer of the project in Harland and brother-in-law of Pirrie), Thomas Andrews (successor of Carlisle), Captain Smith (sea-captain of the Titanic).

From the beginning of the project the mantra that the Olympic line of boats was going to be unsinkable was created due to some features which indeed made the boats more secure than others at the time, as well as the largest and most luxurious. From that point onwards, several psychological flaws impeded perceptions to be re-evaluated, messages to get across, decisions to be questioned, etc.

For some of the characters (Carlisle and Andrews) safety was the top objective, to the point that when the number of life boats was decided to be reduced against the engineers’ criteria Carlisle resigned as chief engineer of the project and left Harland despite of being a relative of the chairman.

For other characters in the story the emphasis was in the size or the luxury: an ample dinning room, clean views from the cabins (not disturbed by life boats, for instance), etc.

The power play, the financial pressure on the project, the deadlines of both departure and arrival in New York, the image to keep before the press, etc., all made that several decisions were taken despite of compromising technical features (life boats reduction and placement), manufacturing operations (working in increasing shifts due to the delay caused by the repair of the Olympic at the same shipyard), operational decisions (such as short time for sea trial of the ship, radio operators priorities and incentives misalignment…), etc., adding to the diminished safety of the trip.

Some of the psychological flaws that were going on when taking those decisions include: anchoring effect (the image of the Titanic as unsinkable was fixed in the mindset despite of decisions compromising safety), bandwagon effect, confirmation bias (negative signals being filter out vs. acknowledging supporting evidences), conformity to the norm, framing effect, normalcy bias (denial and underestimation of the consequences of the disaster once occurred), etc.

Last minute misfortunes added up to the disaster: missing binoculars for the scouts (due to the departure of a crew component who held them), a shorter rope to perform ice tests, radio messages from the Californian boat not being prioritized by operators to be brought to the main deck…

The end to the story is well-known.

Have we progressed as a society since them?

Today we like to think that yes. More requirements regarding safety are put into projects. Regulations are passed to ensure safety. Risk management is used as part of project management to ensure that the kind of decisions taken at the time of the Titanic today they are taken without overlooking the risks behind them.

However, I would like to bring 3 questions raised by colleagues in the Q&A session that followed the presentation:

  • Of the cited characters, who could have been more proactive to prevent the disaster? Taking into account that Carlisle, the chief engineer, went to the point of resigning without (a seemingly) major effect to the fate of the ship.
  • How can we react to a pressure situation under a powerful sponsor? We can try to find allies, framing the situation as an “us” as a group instead of opposing the sponsor.
  • If the Titanic hadn’t sunk, would it be seen as an example of success in project management instead of a disaster? You may dismiss the point too quickly by thinking “oh, yes, but it happened that it sank!“.

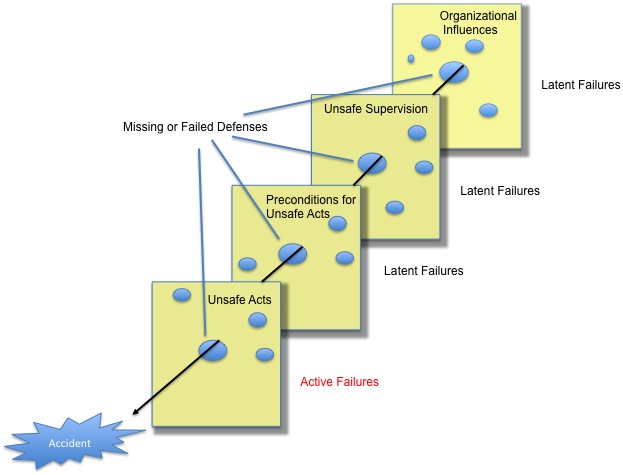
Here, I remembered the theory of the safety in systems seen as layers of safety added one after the other. Each of the layer may have some holes in it just as a portion of cheese (typical image used in aerospace projects). By having several layers, accidents are prevented in most of the cases. However, from time to time the holes in the layers are perfectly aligned and the accident happens (lack of sea trials, radio messages not passed, urgency to reach New York, scouts without binoculars, improper ice tests, power vs. authority struggle in that precise trip in which the chairman of the company travels alongside the captain…).

Cheese model of safety layers in a system.

Cheese model of safety layers in a system.

My takeaways from the conference are:

  • to continuously remind ourselves of the flaws we have in our mental processes (I recommend a couple of books to that respect: “Thinking Fast and Slow” by Daniel Kahneman and “Poor Charlie’s Almanack“, by Charlie Munger),
  • to sharpen our perception of risks (both at work and daily life),
  • to understand that we are a layer (with our own holes) in the safety system (both at work and daily life).

(1) She did not enter much into risk management despite of acknowledging that it had not worked (or rather overlooked).

4 Comments

Filed under Education

Brazil 2014 FIFA World Cup: “group of death”? (using ESPN ranking)

In a previous blog post I used FIFA world rankings to see which was the “group of death” of the following Brazil 2014 World Cup finals.

I received some comments questioning FIFA ranking based on the position of some specific countries: Switzerland, Portugal, Argentina, Colombia, Chile… I am sure that when one looks at how each country is playing he will believe that this or that country plays much better than the other placed higher in the ranking. But, the goodness of the ranking is that it removes perceptions from the process and simply establishes a set of rules by which all teams are going to be measured. It then goes on computing teams’ results along the year and the positions in the ranking are established, for good and bad.

In one of the comments I received I got the suggestion to rather use ESPN Soccer Power Index (SPI) ranking. I was even more attracted to that hint as the ESPN SPI index was introduced by the economist Nate Silver of worldly fame, who many readers will know from his forecasts on recent elections in the USA (check his blog FiveThirtyEight).

In a post from 2009, when the SPI was introduced, just before the 2010 World Cup, he explained how the index was computed (“A Guide to ESPN’s SPI rankings”). As he explained, the process had 4 main steps:

  • Calculate competitiveness coefficients for all games in database
  • Derive match-based ratings for all international and club teams
  • Derive player-based ratings for all games in which detailed data is available
  • Combine team and player data into a composite rating based on current rosters; use to predict future results.
ESPN SPI ranking at the end of Nov 2013.

ESPN SPI ranking at the end of Nov 2013.

The main difference in relation to FIFA ranking algorithm is that it takes player-based ratings for those players who play in clubs in the Big Four leagues (England, Spain, Italy, Germany) and the UEFA Champions’ League. The player-based rating is merged into the national team coefficient. The player-based rating weighs heavily in national teams with many players playing in the main leagues (e.g. England or Spain national teams) and less heavily in other nations which roster is composed of many players not playing in clubs of the 4 main leagues (e.g. Russia).

Other details of the ESPN’s approach are similar to those used by FIFA: e.g. giving weights to results depending on the opponent, measuring the competitiveness of the match, the different confederations, etc.

You can see the top ranked countries at the picture above.

Without entering on whether this or that country is far better placed in one or the other ranking based on perceptions, one simple yardstick to measure them is to see how many of their 32 top countries are not among the 32 countries qualified for the World Cup:

  • FIFA ranking: 7 teams among the top 32 are not in the World Cup: Ukraine (18), Denmark (25), Sweden (27), Czech Republic (28), Slovenia (29), Serbia (30) and Romania (32). All coming from Europe, and not qualified for the World Cup due to the limited amount of places for UEFA countries (they all placed 2nd or 3rd in their groups).
  • ESPN SPI ranking: 6 teams among the top 32 are not in the World Cup: Paraguay (19), Serbia (20), Ukraine (21), Peru (27), Sweden (29) and Czech Republic (30). 4 countries from Europe and 2 from South America, out for the same reason. Here however, Paraguay is still placed 19th despite of being the last country of the CONMEBOL qualifying.

With the information from the ESPN SPI ranking I produced the same table:

Brazil 2014 groups heat map based on ESPN SPI ranking.

Brazil 2014 groups heat map based on ESPN SPI ranking.

And then, the same analysis as in my previous post follows.

The most difficult groups in terms of total ratings are:

  1. B (Spain, Netherlands, Chile, Australia) with 327.
  2. D (Uruguay, Costa Rica, England, Italy) with 323.
  3. G (Germany, Portugal, Ghana, USA) with 322.

Looking at the average ranking, the most difficult groups are:

  1. D (Uruguay, Costa Rica, England, Italy) with 14.
  2. G (Germany, Portugal, Ghana, USA) with 15,25.
  3. B (Spain, Netherlands, Chile, Australia) with 17,5.

And excluding the rating of the favorite team (pot 1) in each group, which is the favorite facing the toughest group?

  1. Uruguay in group D, facing 239.
  2. Spain in group B, facing 238.
  3. Germany in group G, facing 234.

Then, combining the 3 approaches, the toughest group is between B (in terms of combined ratings) or D (in terms of average rating and from the favourite point of view).

Using the ESPN ranking group G would definitely would not be the toughest one, but the 3rd toughest.

I would understand ESPN journalists calling group B or D the toughest one. What strikes me is why FIFA website content editors call group B the “group of death” if by their ranking that group would be the group G!

It will be interesting to see how one ranking fares against the other at the time of predicting the actual development of the Brazil 2014 World Cup.

2 Comments

Filed under Sports

Brazil 2014 FIFA World Cup: “group of death”?

The draw of the groups for the Final phase of the football World cup to take place in Brazil from June 2014 has taken place today. As it always does, it drew much attention and right afterwards lots of speculation, especially to identify which one will be the so-called “group of death”.

I read in the Spanish sports press that Group B, where Spain is placed, is called as “lethal”. I thought to myself: “playing the victims before the competition”. Then I read in the FIFA website:

Spain, the Netherlands, Chile and Australia will make up the proverbial ‘group of death’ at the 20th FIFA World Cup™, while Uruguay, Italy, England and Costa Rica will comprise another intriguing pool.

Well, no.

Take a look at the groups in the picture. What would be your guess as to the most difficult or the easiest group?

Brazil 2014 groups

Brazil 2014 World Cup groups.

FIFA ranking end Nov 2013

FIFA ranking end Nov 2013

I then decided to take a quantitative approach using precisely FIFA world rankings, a classification made up with the points each country is getting for their results every month.

FIFA uses a formula to compute those points:

M x I x T x C = P

M: winning, drawing or losing a match

I: importance of the match

T: strength of opposing team

C: confederation strength weights

P: points for a game

Take a look in the picture in the right, to see the FIFA rankings at the end of November, just before the draw has taken place. You will see Spain in the top spot with 1,507 points, well ahead of Germany, Argentina, etc. Most of the countries in the top 23 that you can see in the picture are represented in the World Cup with the exception of Ukraine. See the whole ranking here.

With this information I built the following table, attaching to each country in the different groups the current ranking and points. Then, I calculated the average ranking of each group and the total amount of points. I then, also summed up the amount of points per group excluding the favourite in each group, showing in that way which has been the most difficult or the easiest group for the favourite countries (those placed in the pot 1 of the draw). Finally, I coloured results in a heat map: more red, more difficult. Which is then the “group of death”?

FIFA 2014 groups heat map.

FIFA 2014 groups heat map.

As you can see the most difficult groups in terms of total points are:

  1. G (Germany, Portugal, Ghana, USA) with 4,358.
  2. B (Spain, Netherlands, Chile, Australia) with 4,191.
  3. D (Uruguay, Costa Rica, England, Italy) with 4,031.

Looking at the average ranking, the most difficult groups are:

  1. G (Germany, Portugal, Ghana, USA) with 11,25.
  2. D (Uruguay, Costa Rica, England, Italy) with 14,25.
  3. C (Colombia, Greece, Côte d’Ivoire, Japan) with 20,25.

And excluding the points of the favorite team (pot 1) in each group, which is the favorite facing the toughest group?

  1. Germany in group G, facing 3,040.
  2. Uruguay in group D, facing 2,899.
  3. Spain in group B, facing 2,684.

Then, combining the 3 approaches, to me it becomes clear that the toughest group is G, with Germany, Portugal, Ghana and USA, by the total amount of points, ranking of the teams and in relation to what Germany will face.

Then, I would say that the second most difficult group is D, both looking at ranking and from the point of view of Uruguay. The third being group B (though between D and B, depends on the approach).

On the other hand, for the Netherlands, Chile and Australia (the worst team of the competition) it is clear that group B is the most difficult, as from their point of view their group has the most points excluding themselves (mainly thanks to the 1,507 of Spain).

Finally, after having done the analysis and seeing the heading of conversations on groups’ difficulty are taking I realize how few people have read about “Soccernomics” or “Moneyball“… just like with stock markets, at least this is just football.

8 Comments

Filed under Sports

Informe de PISA 2012

Esta semana la OCDE (Organización para la Cooperación y el Desarrollo Económicos, OECD en sus siglas en inglés), una organización compuesta por 34 estados mayormente desarrollados, ha publicado su ya famoso informe PISA (Programme for International Student Assessment) 2012. En el último estudio las pruebas se centraban en las matemáticas:

“Las pruebas de PISA son aplicadas cada tres años. Examinan el rendimiento de alumnos de 15 años en áreas temáticas clave y estudian igualmente una gama amplia de resultados educativos, entre los que se encuentran: la motivación de los alumnos por aprender, la concepción que éstos tienen sobre sí mismos y sus estrategias de aprendizaje. Cada una de las tres evaluaciones pasadas de PISA se centró en un área temática concreta: la lectura (en 2000), las matemáticas (en 2003) y las ciencias (en 2006); siendo la resolución de problemas un área temática especial en PISA 2003. El programa está llevando a cabo una segunda fase de evaluaciones en el 2009 (lectura), 2012 (matemáticas) y 2015 (ciencias).”

Como muchos de los informes de la OCDE, el volumen y la profundidad de los análisis es admirable. Se ofrecen todo tipo de tablas comparativas, las preguntas que los alumnos debían responder, gráficos interactivos, etc. El informe ofrece también una nota sobre los resultados en España [PDF, 395KB]; una lectura muy interesante que paso a comentar, después de dejar un par de imágenes que resumen la situación:

  • Resultados de España:
    • Matemáticas: ocupa según el ránking [PDF, 1MB] la posición 33ª de entre 70 países del informe, con un resultado medio de 484 frente a 494 de la media de la OCDE (en una horquilla de entre 368 y 613). Un 23,6% de los alumnos obtiene un bajo rendimiento y solo un 8% un rendimiento excelente.
    • Lectura y ciencias: los resultados (488 y 496) son también inferiores a la media de la OCDE (496 y 501).
  • En España no faltan recursos (casi 60.000€ / alumno), ni profesores, ni horas de clase.
  • La diferencia de resultados entre regiones es abismal [PDF, 3MB], de hasta 55 puntos entre Navarra (517 puntos, lo que le situaría en el puesto 15º del ránking de países) y Extremadura (461). Las condiciones socio-económicas explican en más de un 85% estas diferencias. En un alumno de 15 años, este retraso entre regiones supone el equivalente a 16 meses de escolarización.
  • Crece la desigualdad: los desfavorecidos económicamente, los inmigrantes, las chicas y los repetidores se encuentran peor que hace una década.
  • Solo un 8% de los alumnos obtiene un rendimiento excelente (frente al 13% en OCDE) y solo un 6% de los más desfavorecidos es capaz de obtener resultados mejores a los que cabría esperar de su situación.
  • Sobre los alumnos:
    • Están motivados pero les falta confianza al enfrentarse a las matemáticas.
    • Falta puntualidad (35% reconoce haber llegado tarde en los días anteriores al estudio) y hay un gran absentismo (un 32% se había saltado una clase y un 28% faltado un día en las semanas previas al estudio; frente a 18% y 15% OCDE), lo que de por sí explica prácticamente el retraso en matemáticas, dado que el absentismo se asocia con hasta 37 puntos en el resultado (equivalente a un año de escolarización).
  • Sobre los profesores:
    • Falta motivación (un 25% de los alumnos acude a centros donde los profesores están desmotivados, frente a 10% OCDE).
    • Faltan evaluaciones a los profesores y no tienen consecuencias (salario, desarrollo, promociones, reconocimiento público, asunción de nuevos roles…).
    • Se resisten al cambio (29% frente a 19% OCDE), lo que dificulta el aprendizaje.
    • Son poco colaboradores: solo un 10% de los estudiantes acude a centros donde profesores más experimentados observan las clases de otros profesores (frente a 69%), solo un 22% revisa y planifica los contenidos con otros profesores (frente a 60%) y no se usan las tutorías (26% frente a 72%).
    • Son poco abiertos a mejoras: solo un 27% de alumnos acude a centros que piden ayuda externa para mejorar (frente a 43%)
  • Falta transparencia: solo un 13% de los alumnos acude a centros que publican sus resultados (frente a 43%) o comparan sus resultados con otros centros (44% frente a 62%).

Entrando en profundidad, el informe PISA incluye hasta 4 volúmenes con cientos de páginas cada uno analizando los siguientes asuntos (en inglés y de lectura gratuita en línea):

Estos informes deberían ser el punto de partida de cualquier política de educación que busque mejorar la pobre situación actual en España.

Por último, tenía curiosidad por ver qué tipo de preguntas se les hacen a los alumnos. Éstas vienen clasificadas en 6 niveles de dificultad. Incluyo debajo un caso de mayor dificultad:

PISA 2012 question 6

PISA 2012 pregunta 6.

Siempre me ha llamado la atención la cantidad de periodistas, tertulianos y adultos en general que se apresuran a criticar el bajo nivel de la educación que reciben los alumnos hoy en día. Viendo los resultados del informe PISA, parecen tener razón. Quería incluir aquí esta pregunta, porque estoy razonablemente seguro de que no más de un 8% de esos periodistas, tertulianos y adultos en general serían capaces de responder a esta pregunta correctamente. Aún así, viven en la creencia de que ellos sí recibieron una educación de calidad (ni que hablar de que la superaron satisfactoriamente).

6 Comments

Filed under Education

MSF boutique

Few days ago, I received a letter from the NGO “Médecins Sans Frontières” which I especially liked for two reasons:

  • it included a couple of interesting infographics worth posting due to the ease with which they conveyed information,
  • I got to know about the existence of an online boutique where one can buy useful items and support MSF at the same time.

See the images below, especially what can be afforded by the purchase of some of the items from the boutique (e.g. a teddy bear pays for 18 vaccines against meningitis!)

What can be afforded

What can be afforded

Use of funds.

Use of funds.

As you can see the source of the information for the second infographic is the yearly report of MSF 2012 [PDF, 3MB], I only wonder why they don’t include such kind of self-explaining graphics in the report.

Leave a comment

Filed under Helping others

Pricing beer in Greece

There is something puzzling that we constantly found in the different restaurants we dined at in Greece: the inconsistent pricing of beer. Or rather, the consistent pricing of it in a different fashion as it is done in other places in the West.

Take a look at the menu below.

You may see that Alpha draft beer is sold in two quantities:

  • 300mL for 2€ and,
  • 400mL, for 3€ euros.

That yields a price of 6.7€/L for the 300mL and a price of 7.5€/L for the 400mL.

Read the previous line again.

Then, who would buy the larger quantity if it is sold at a higher price per litre (12.5% higher)? Normally, one would expect some discount linked to volume. Well, not in Greece with beer :-).

Pricing beer in Greece.

Pricing beer in Greece.

We found restaurants in which the differences in pricing were more striking but only took this picture.

Another puzzling fact which we didn’t record was that for a same beer (say Alpha) in most places they sold the bottled beer cheaper than the drafted one (for a same volume). Again this was surprising, as we normally see draft beer sold cheaper, and there are certainly cost advantages to selling draft beer. But then the difference in pricing strategy versus how it is done in the West could have been explained from the demand side (not the supply) if the Greeks value much more draft beer.

1 Comment

Filed under Economy, Travelling

Battle of Thermopylae

During our recent trip to Greece, on the way back from Meteora to Marathon we decided to make a short stop at the Thermopylae. Many battles have been fought at that place, but perhaps, the most known today is the one fought in 480 BC between an alliance of Greek city-states, led by King Leonidas of Sparta, and the Persian Empire of Xerxes I. I was curious to visit the place.

That is the battle in which the movie “300” was inspired (*). We saw the movie again right after returning from the trip.

As it usually happens, the movie puts some more drama to the story. In the movie the battle field is a tight pass close to a cliff, whereas the Thermopylae are not such tight, and certainly there are not cliffs, rather plains from the mountains to the sea.

The movie has Leonidas as the very last Spartan to pass by in the fight, whereas in the explanation panels at the Thermopylae it is stated that he died in the very first phase of the battle, far from Kolonos hill (reading the Wikipedia article it seems that he could have survived to the last day).

Description of the battle.

Description of the battle.

That Kolonos hill is a small promontory where the last Spartans retreated to fight the Persians till death. Several arrow heads were found in the hill-top in a 20th century expedition. Today, there is an epitaph by Simonides which reads as follows:

“Go tell the Spartans, stranger passing by,
That here, obedient to Spartan law, we lie.”
Kolonos Hill.

Kolonos Hill.

In the place there is a statue of king Leonidas, with the now famous inscription ΜΟΛΩΝ ΛΑΒΕ (“Come and get them!”) which was Leonidas response when he was asked to turn their weapons. Today those words are used as a motto in several armies.

Statue of King Leonidas.

Statue of King Leonidas.

ΜΟΛΩΝ ΛΑΒΕ.

ΜΟΛΩΝ ΛΑΒΕ

There are many other sentences supposedly used by Leonidas that are repeated today, if only by the impact of the movie 300.

Leonidas: Spartans! What is your profession?
Spartans: HA-ROO! HA-ROO! HA-ROO!
Persian Emissary: […] Our arrows will blot out the sun!
Stelios: Then we will fight in the shade.
Leonidas: Spartans! Ready your breakfast and eat hearty… For tonight, we dine in hell!

I expected to have found some more merchandising or tourism-related business created around the battlefield but we only saw the epitaph and statues, not a single selling post. Possibly in high season, during, summer time there are some, but not in late Autumn. I searched through the web and there are indeed Greek businesses which sell memorabilia related to the movie and the battle, it is only that they sell online and we didn’t encounter them at the place (compare that with the setting up of a food franchise business out of the movie “Forrest Gump“).
I encourage anyone travelling through the Greek A1 on holiday to make the brief stop, as it doesn’t require a long detour from the highway and lets you quietly (and free) contemplate a place charged with History.

(*) A sequel of that movie will be released in 2014, “300: Rise of an Empire“.

Leave a comment

Filed under Travelling