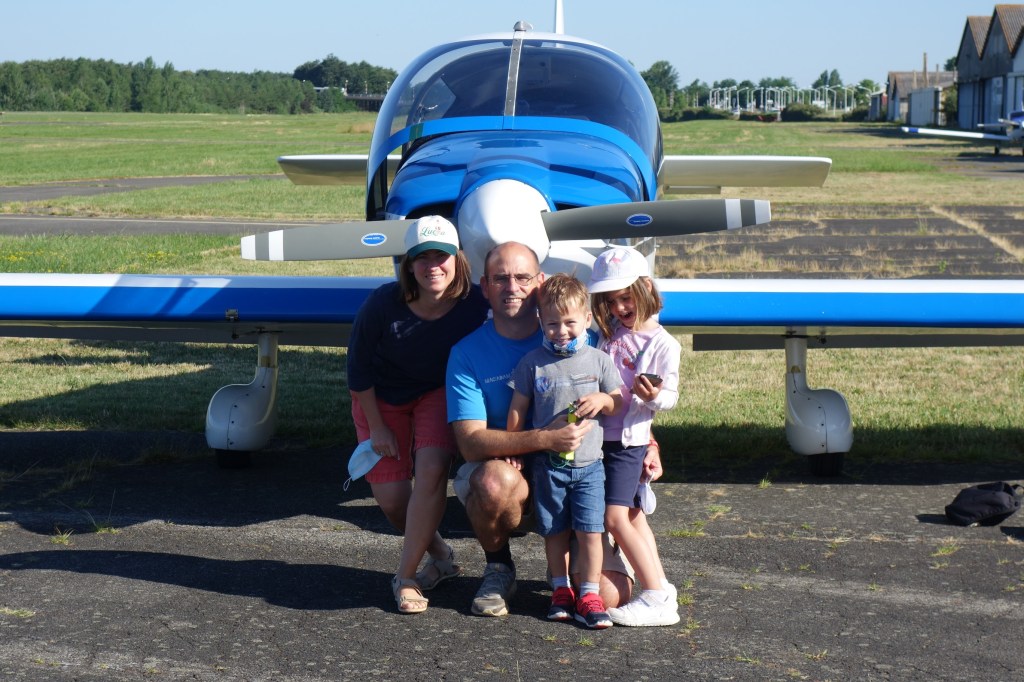
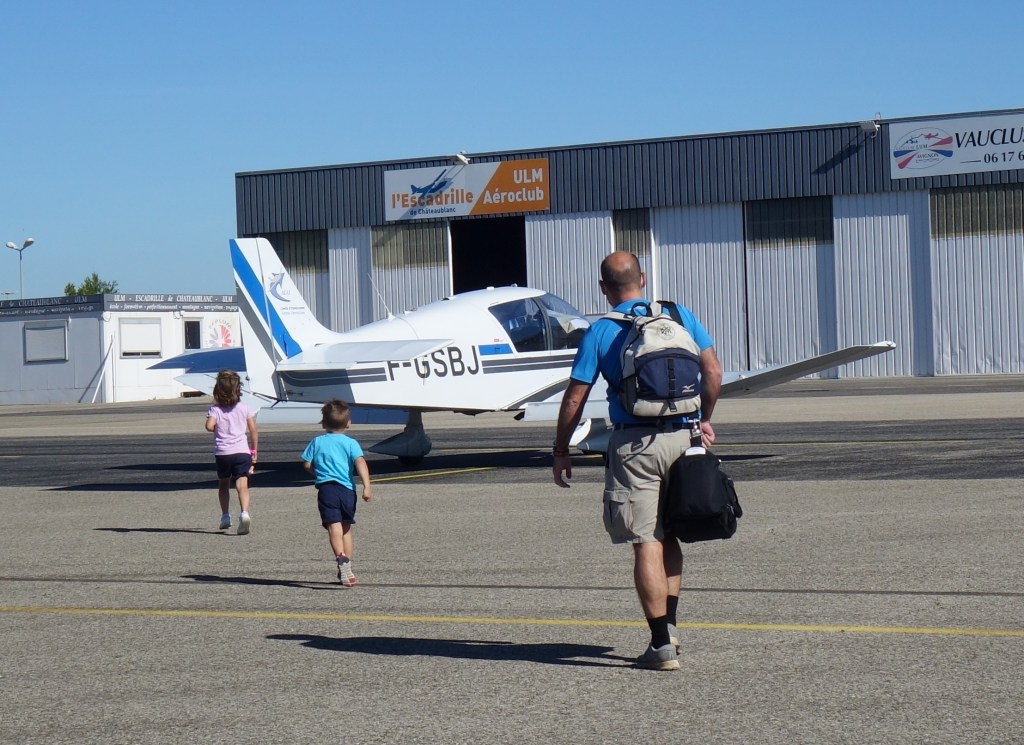
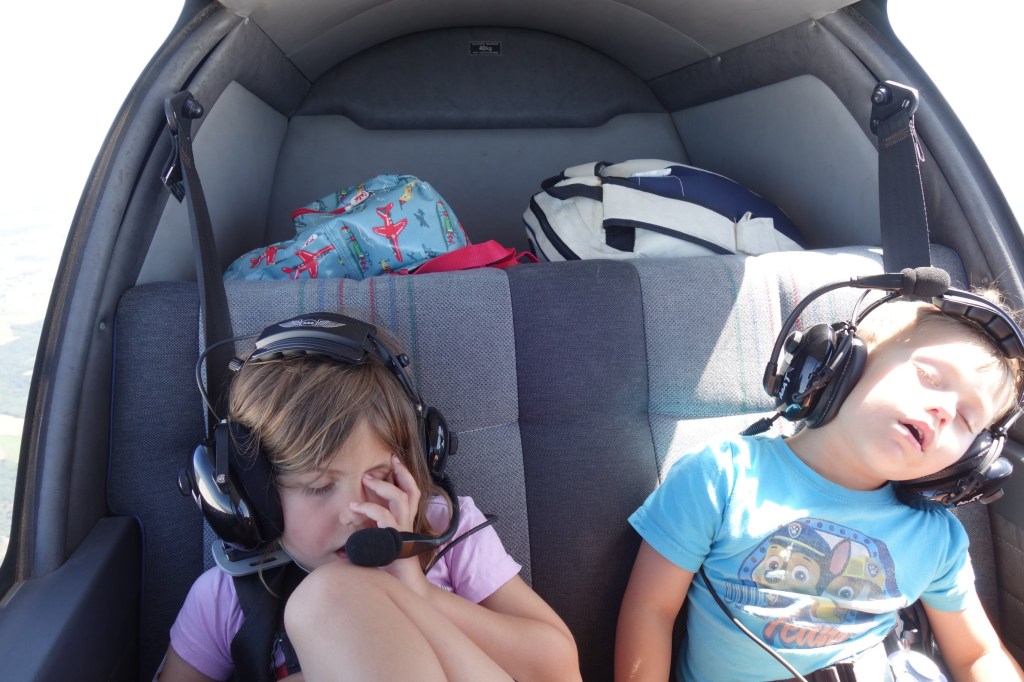
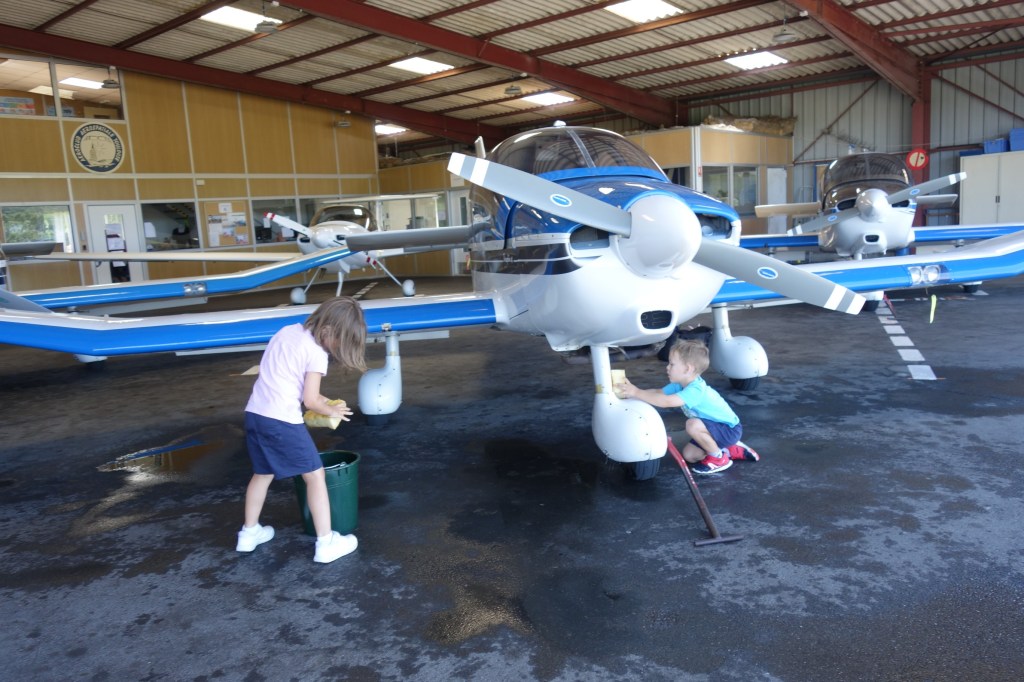
This weekend, with Luca and our children, we took one of the aeroclub’s DR-400 to make a flight excursion from Toulouse (France) to Avignon, in Provence.
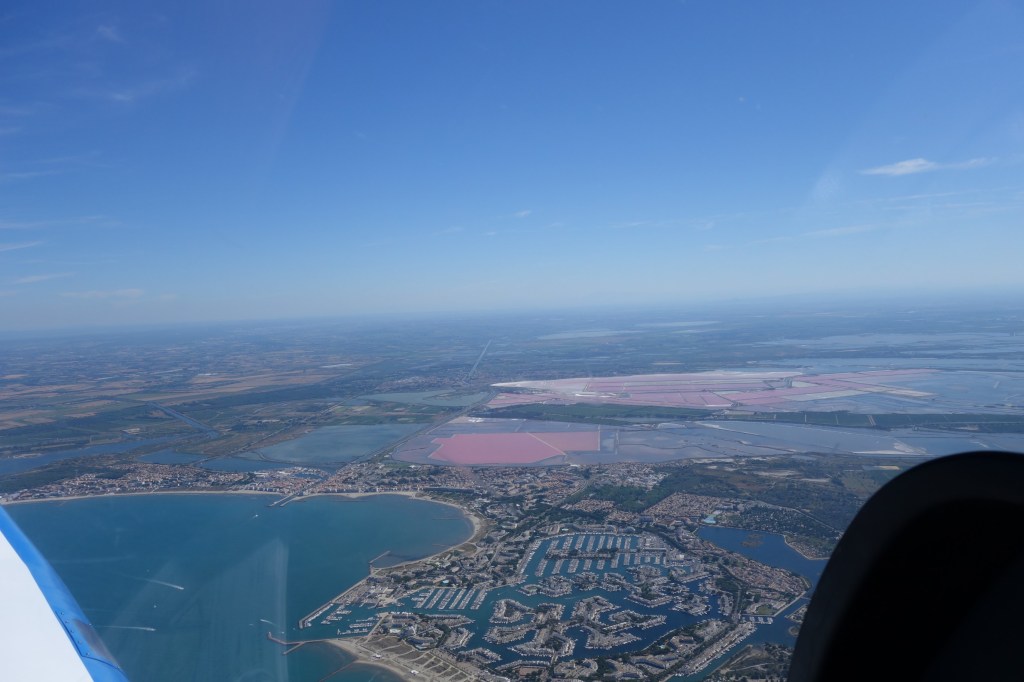
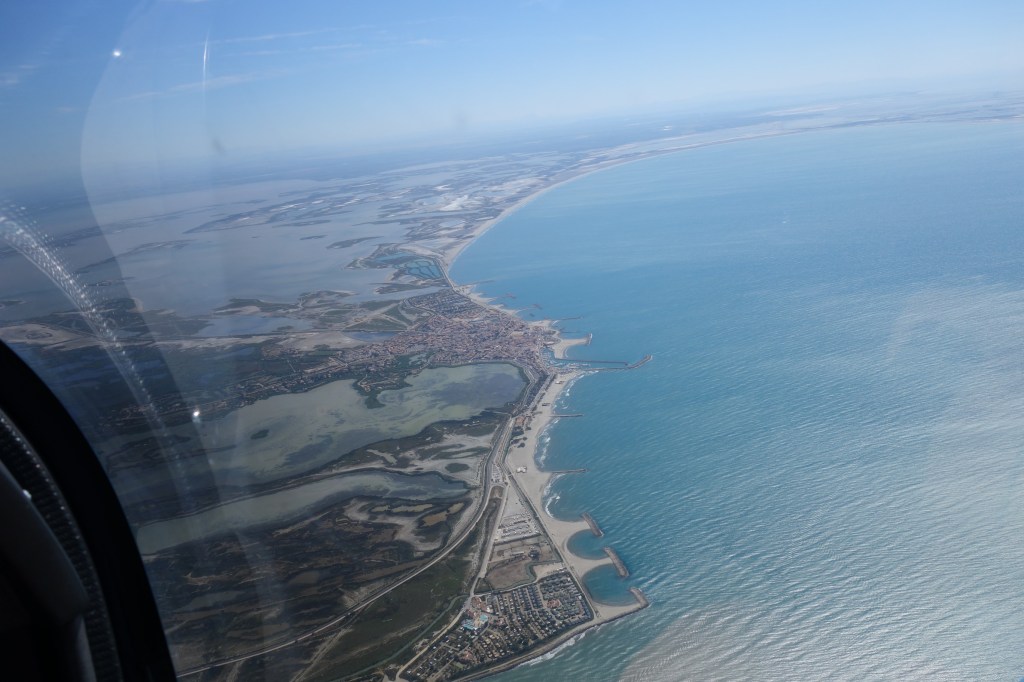
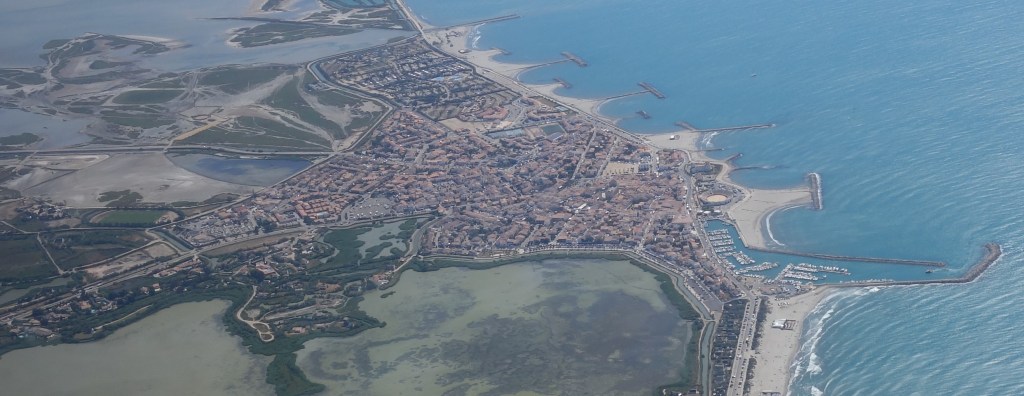
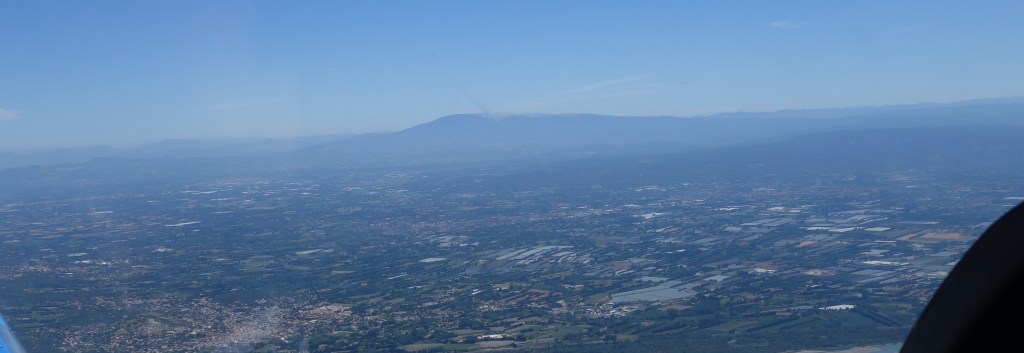
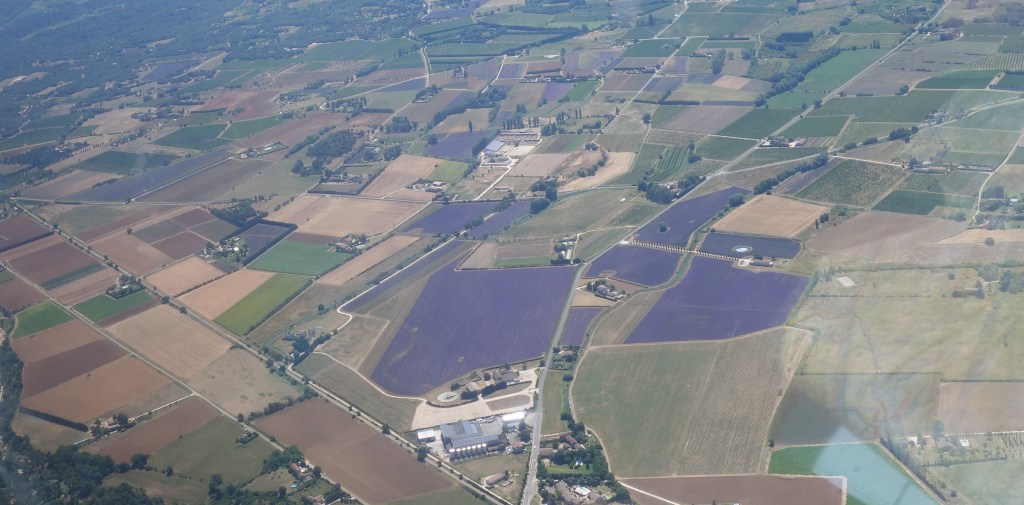
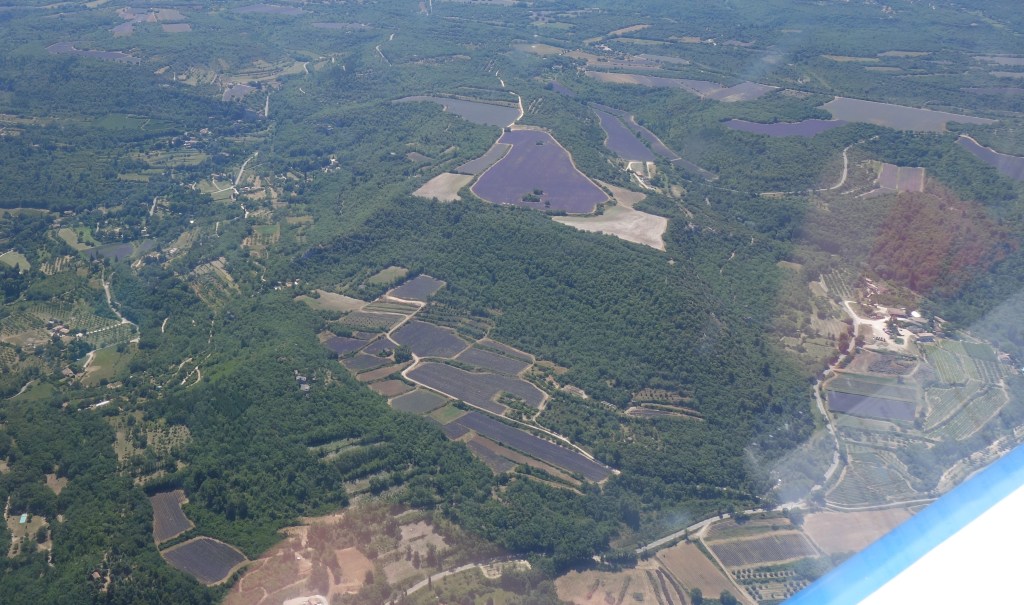
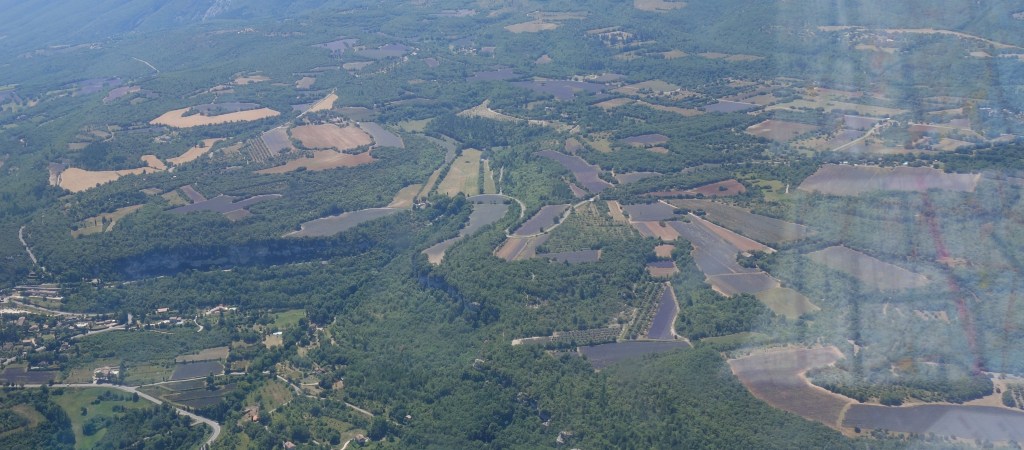
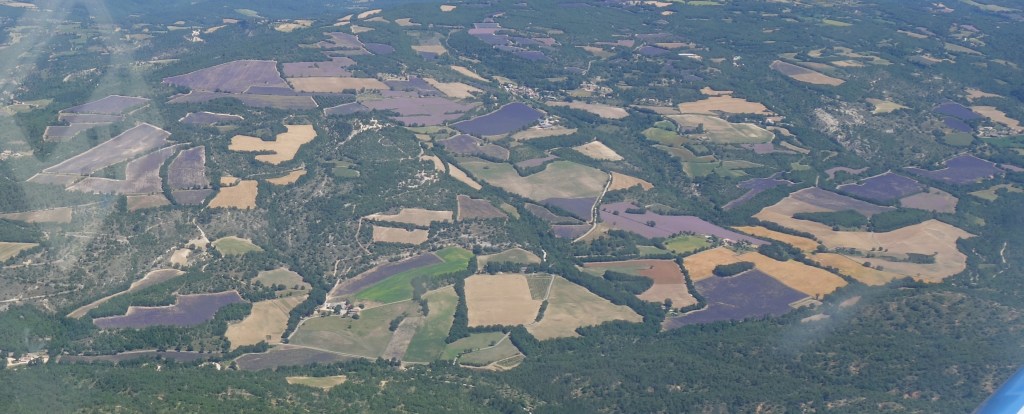
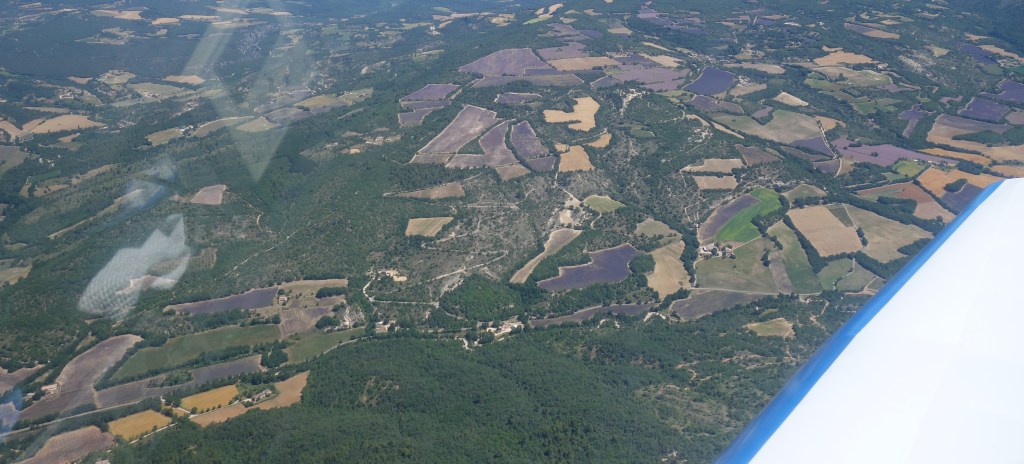
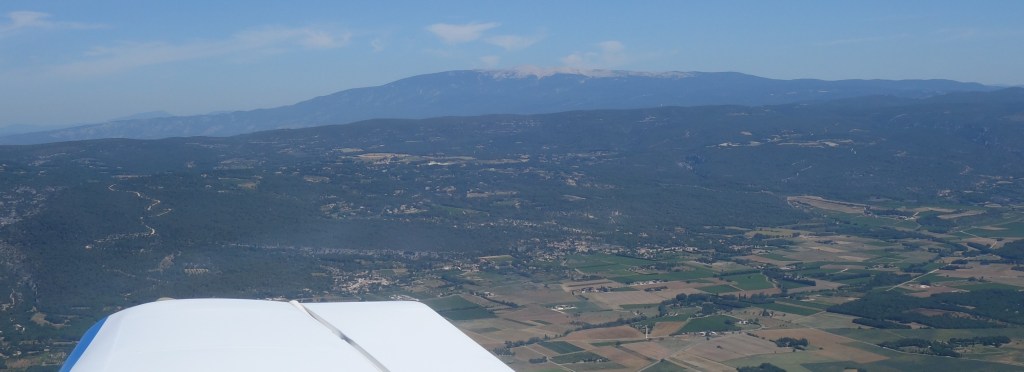
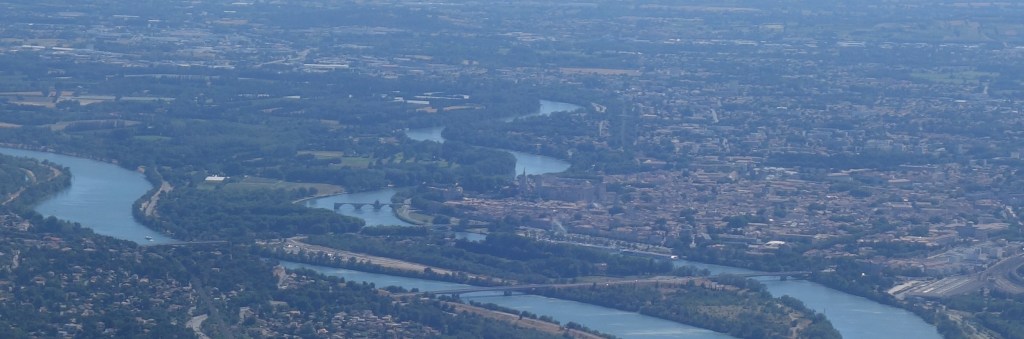
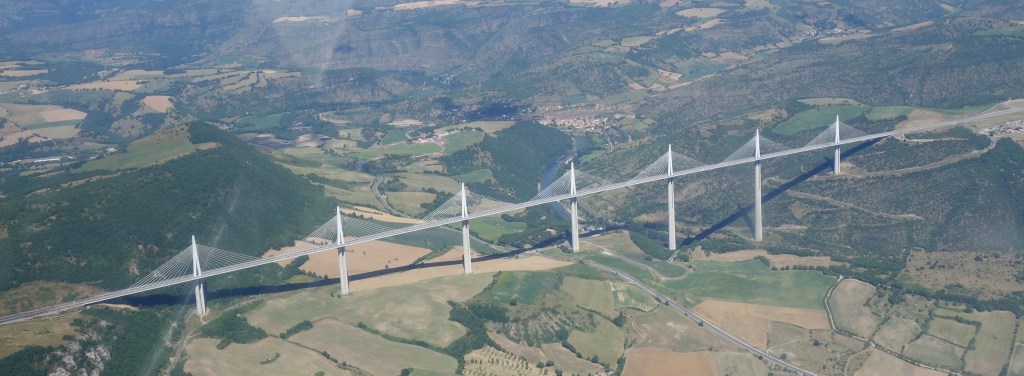
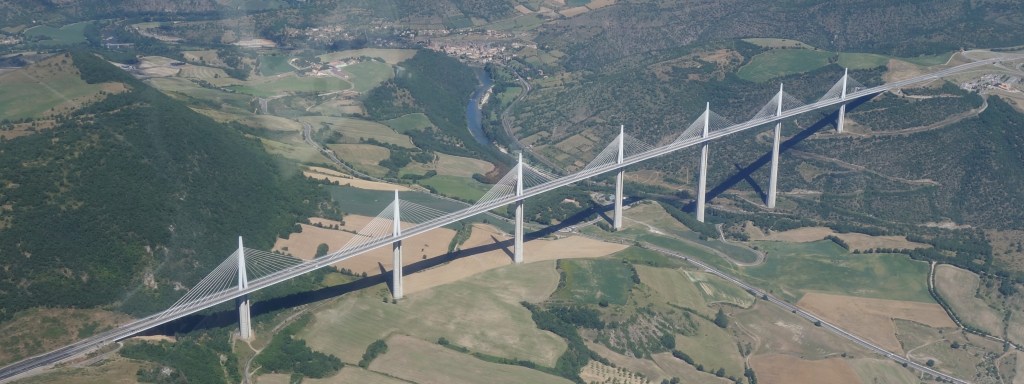
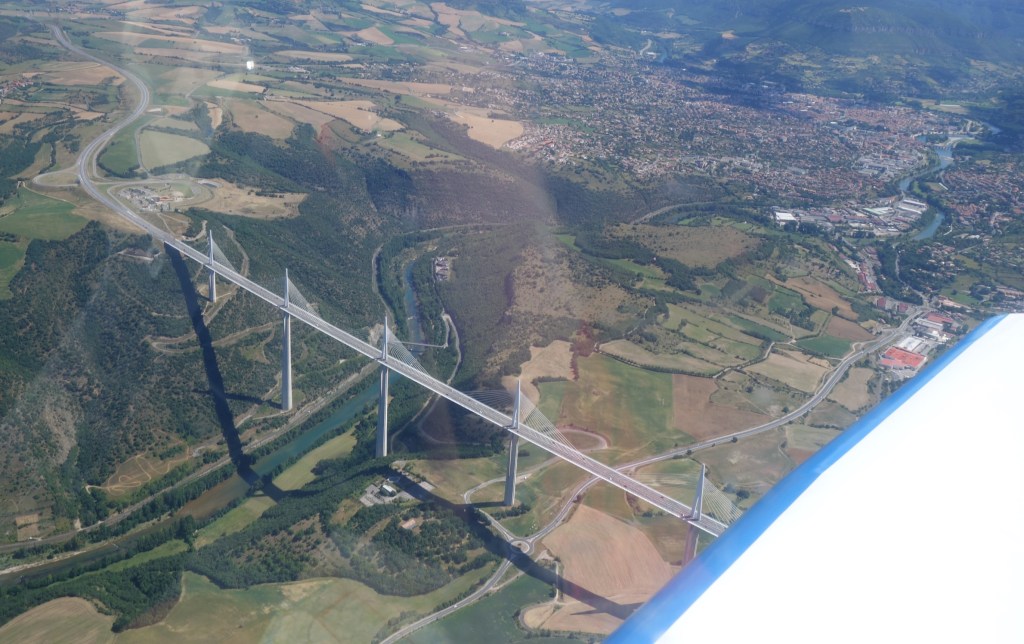
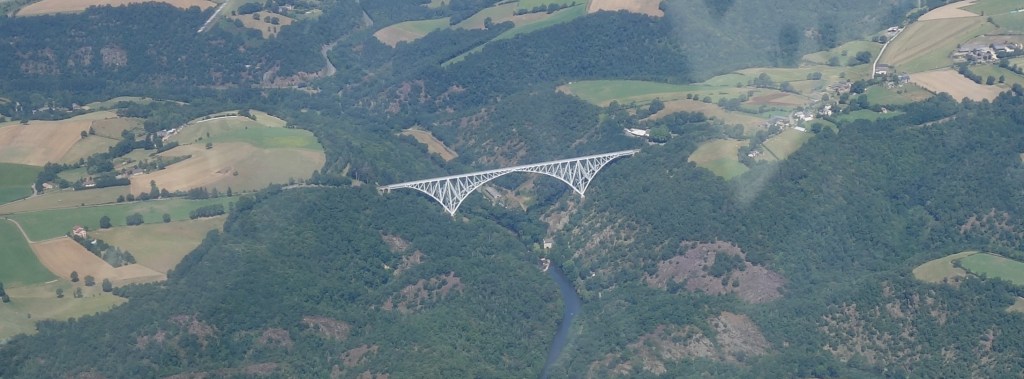
The main purpose of the trip was to fly over the flourishing lavender fields in Provence. Other highlights of the flight would be flying over the French Côte d‘Améthyste, flying over the Camargue region with the wetlands of the Rhône delta, watching the Mont-Ventoux from up close, seeing the Pont d’Avignon (from the plane this time, no dancing), flying over the Hérault Gorges, the Viaduct of Millau, the Viaduct of the Viaur and we attempted as well to see the Pont du Garde, but we missed it (next time!).
I will be short in words in this post, thus I will first show here below all the beautiful pictures of the flight in chronological order and at the very bottom I will include a few paragraphs with the technical information of the flight in case anyone is interested in planning a similar trip.
We made two flights. The first one from Toulouse Lasbordes (LFCL) to Avignon Caumont (LFMV) lasted 2h25′ including the excursion to the regional park of Luberon to see the lavender fields (a detour of about 30′). The return trip took us 1h59′. Both trips could take somewhat less time if the routes were a bit more direct. We started both flights with the main and supplementary tanks full (in theory up to 110 + 50 litres, thus 160l) and before the second flight we did a refill of nearly 77 litres; that would be the block fuel for the first trip (thus 31.7l per hour just a bit below the 33 indicated in the manual at maximum take off weight (1,000kg for the DR-44)).
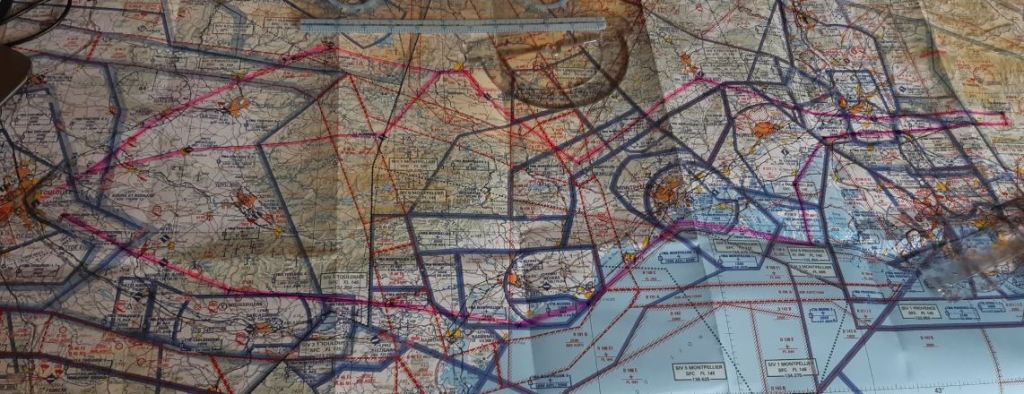
For both flights I filed a flight plan (calling the BRIA of Bordeaux) even if not required in France (when not flying to the islands or abroad), but that eases a lot the flying through many different CTRs, class D flight spaces, getting flight information service, traffic information, etc.
In these times of low commercial traffic we requested to overfly the coast at a rather high altitude (3,500ft instead of the mandatory maximum of 1,000ft from Montpellier to Marseille in normal times) which was granted without hesitation by the traffic controllers. That alleviated a bit the buffeting of the plane on the often windy French Mediterranean coast.
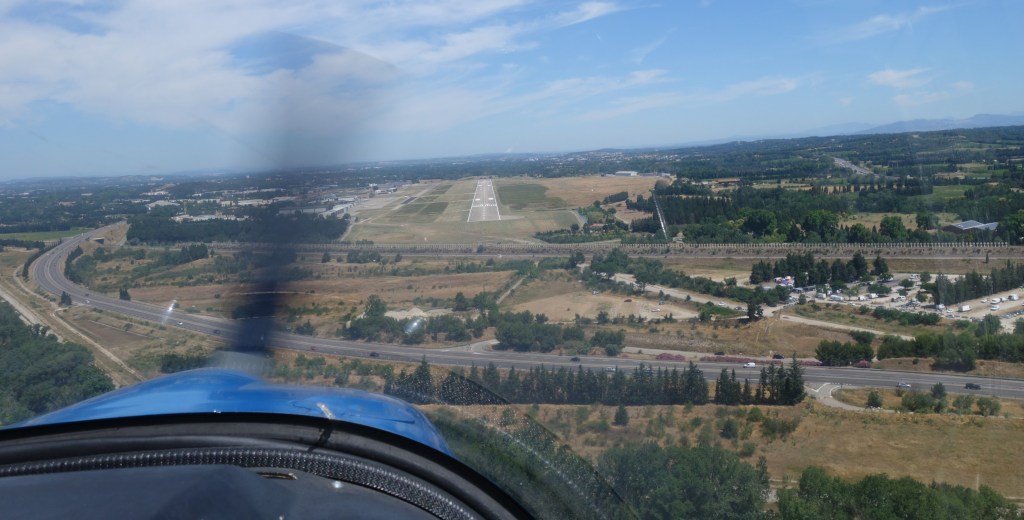
Avignon Caumont airport turned out to be a rather windy one being in the Rhone Delta. Most airports in the whereabouts had windy forecasts. We landed with winds announced by the controller of 15-20kt and on the departure the day after we had 22-32kt, though more or less aligned with the runway, 35 both times. The runway is however long (1,880m) and wide (45m). Had we had to abort the landing we had planned alternative diversion airports nearby, but most probably we would have gone away from the Delta region, all the way to Millau (thus the filling up the tank with more than double the amount of fuel we needed). The landing fees and 24-hour parking altogether cost 29.6 euros. The fuel station operated with the Carte Total.
We stayed over at the Best Western hotel by the airport at Avignon, at walking distance from the terminal (the reservation could be cancelled without charge up to 14:00 of the day we arrived, thus 2 hours later than our estimated landing time, in case we had to divert to somewhere else). We booked a family room with four beds and sofa bed with breakfast for 135 euros which could be paid in cheques vacances. The hotel has a swimming pool which was needed for the kids to relax in the afternoon. At walking distance there was as well a Courtepaille restaurant.