Last Sunday October 30th, at the time that this post is being published, together with my friend Serna, I was in the departure line of the Dublin marathon, the “Friendly marathon” according to one of their lines, the 4th largest marathon in Europe with about 19,000 people registered, almost 17,000 finishers.
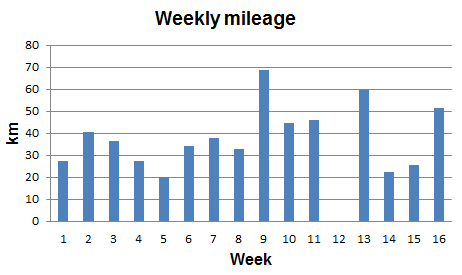
I subscribed to the marathon last July but I had it in mind sometime before, right after having completed the marathon in Albi, which didn’t go very well. This time I tried to follow more closely the training plan and I did it. If I arrived to Albi with just 530 km of training in the legs, I arrived to Dublin with above 660 km (in the previous 16 weeks), still a bit short but somewhat better. I had also managed more long runs and intervals sessions, even if I wasn’t doing them as fast as in previous years.

But not everything in the training period of 16 weeks had been rosy. Since late 2011 I use some insoles to compensate for a slight difference in the length of the legs, which normally doesn’t bother me, but when you’re clocking nearly 2,000 km a year hitting the streets you start to notice it. I hadn’t got new insoles since 4 years ago and the ones I used were rather worn out. I knew I had to change them but I kept postponing it, until I ran the Toulouse half marathon on September 18th, after which I simply couldn’t walk for two days. Visits to the doctor, podiatrist (x2), the physiotherapist (x6), plenty of pain killers, medicines, etc., and I managed to continue the training after a 10-day break (week 11-12 of the plan).
Having gone through that I was rather happy with just being able to be at the departure line of the marathon and running it without major problems, knowing that, despite of the injure, I had trained well enough.

At first sight, the route of the race didn’t seem very appealing. It gave the impression that instead of taking the runners through the city centre, we were taken far away around the outskirts. Despite that, the atmosphere during most of the race was great, overwhelming. There were plenty of Dubliners almost in every street, crowds cheering at the runners, “Keep going!”.
The organization of the race was superb. From the management of the departure, with minimum waiting time, plenty of facilities, good spacing between starting waves so running was possible from the beginning, to supplies during the race, and a nice round medal at the end, or goodies that included a finisher t’shirt, a frontal lamp or a reflective running vest.
There were plenty of pacers. We decided to start with those of 3h50′ and see for how long we could keep up with them. The truth is that after about 7 km we took some metres of advantage and we kept running comfortably a bit faster for many kilometres. Some time after the half marathon my friend, who hadn’t managed to complete a moderate weekly mileage along the training season, dropped and I kept going forward. I was telling to myself to go on one more kilometre at pace (“run the kilometre you’re in“) until the moment when I would face the wall and then see how I could manage it. The fact is that I never faced it (“trust the training“).

This marathon has been the first one in which I have managed to complete what is called a “negative split”, that is running the second half marathon faster than the first one. In my case, I completed the 1st half in 1h53’34” (not very fast, doubling for a 3h47 marathon) and the second half in 1h48’50” (doubling for a 3h37′). Every segment of 10k I did it faster than the previous one. This is something that you’re not fully aware while running, but you notice it. You push forward and the legs respond well. You say, let’s go for the 33rd km and see, for the 34th, 35th, 36th, 37th… at some point you think I am there, I’m not going to slow down at all.

It has not been the fastest marathon I have completed (that was in Rotterdam 2014, this one in Dublin has been my second fastest), as I started more conservatively, but I enjoyed every minute of it.